
Aug 28, 2025
Basics
What Is Swing High and Swing Low in Forex Trading?

Swing highs and swing lows are key clues because they show clear turning points on the chart. A swing high is the peak right before a price starts to drop. A swing low is the lowest point right before the price starts to rise.
You can treat them as simple pivot points where the market tests direction and leaves a useful marker for future trades. When you read swings well, trends and ranges stop looking random. You can spot where buying began, where selling took over, and where the next move might start.
How to identify swing highs and swing lows
The easiest way to spot them is to wait until you have at least three candles in a row, then focus on the middle one. If its high sits above the highs of the candles on both sides, that marks a swing high. If its low sits below the lows of the candles on both sides, that marks a swing low. Confirm the pattern only after the neighboring candles close, so the signal is clear.
This rule gives you simple and repeatable signals. It stops you from guessing on every small move and lets you mark levels only after the price makes a clear turn. In fast markets, the pattern appears more often, but the rule stays the same: wait for the three candles, then mark the swing.
Some traders want extra clarity. They add a ZigZag or a Fractals indicator in MT4 or MT5 to highlight major turns. These tools do not predict. They only make swings easier to see.
For real-time trading, combine swing logic with price action. A pin bar or an engulfing candle at a swing level can be a strong hint that a move is real. Let the swing mark the area and let the candle show the entry.
Swing highs and lows in market structure
Market structure is the sequence of swing highs and swing lows. In an uptrend, price makes higher highs and higher lows. In a downtrend, it makes lower highs and lower lows. When swings move sideways, the market is in a range.
A break in that sequence can warn of a new direction. If a price stops making new higher peaks and then drops below a recent low, the upward move may be losing strength. If the price stops making new lower lows and then rises above a recent high, buyers may be taking control and pushing the market the other way. Watching these changes helps you see reversals early.
Swing points also let you draw trendlines and channels with confidence. Connect higher lows in an uptrend or lower highs in a downtrend and you get clean guides for pullbacks and breakouts. Use the same points to outline supply and demand zones.
Swing highs and swing lows are the basic map of how a price moves. When you mark them first, the rest of the chart is easier to read and your trading choices become clearer. Entries, exits, and stops all improve when the structure is clear.
Practical examples on charts
The charts below show how swing highs and swing lows build market structure. Arrows and a ZigZag line mark each turn as we move from an uptrend to a downtrend and then to a range that finally breaks out.
Example of a clear uptrend with the ZigZag indicator, created by higher highs and higher lows
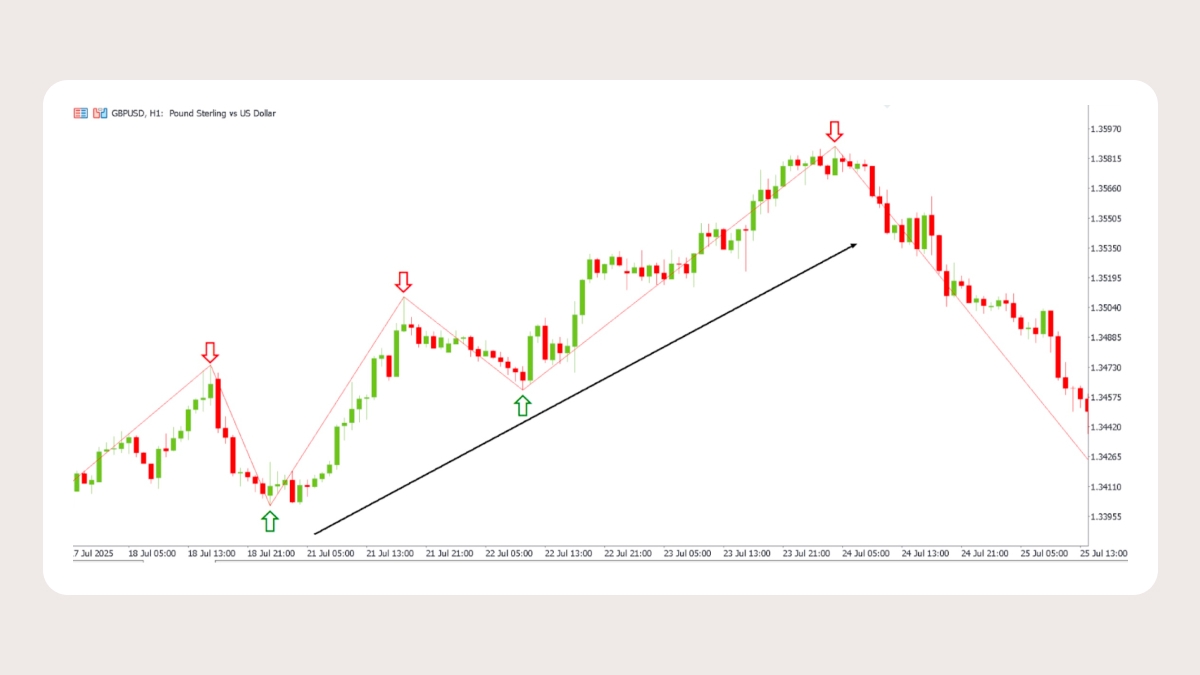
The ZigZag connects swing highs and lows on GBPUSD H1 and shows a clear uptrend. Red arrows mark higher highs and green arrows mark higher lows, while the black line is a trendline through the lows. On the right, the sequence fails as the price breaks below the last higher low and starts to fall.
Example of a clear downtrend created by lower highs and lower lows
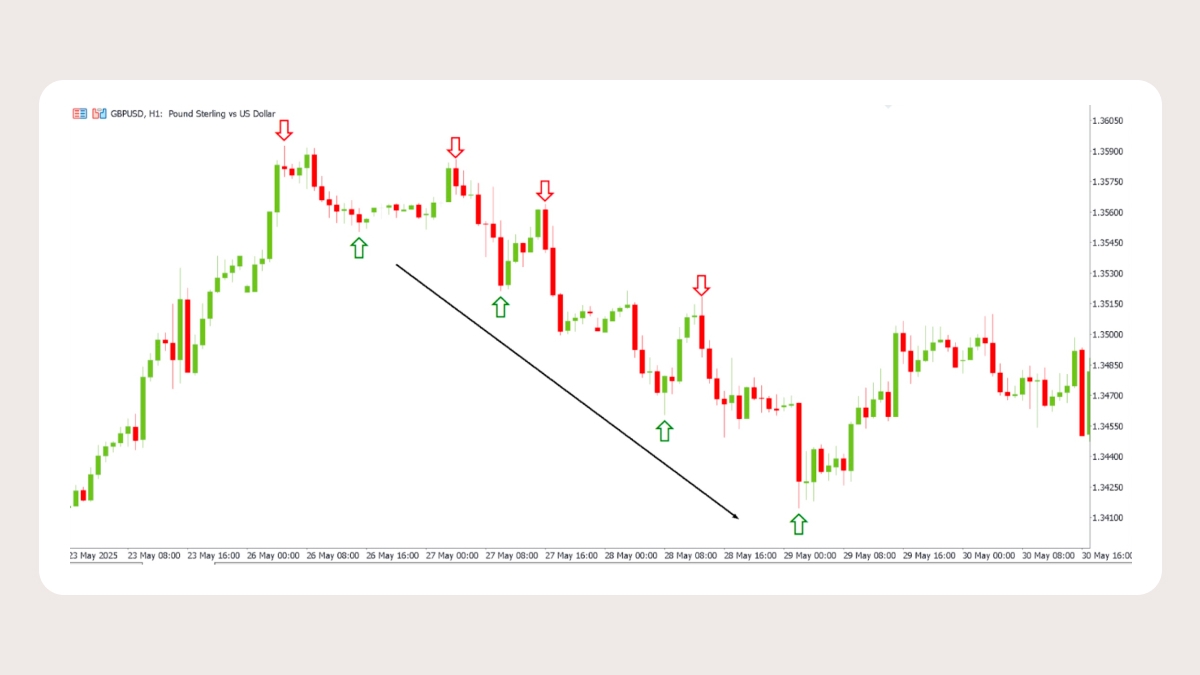
This GBPUSD H1 chart shows a clear downtrend built from lower highs and lower lows. Red arrows mark each lower high and green arrows mark each lower low, while the black line is a falling trendline through the lows. Each bounce fails below the last peak, and the decline continues until the price breaks above a prior lower high.
Example of a clear range → flat swing highs/lows
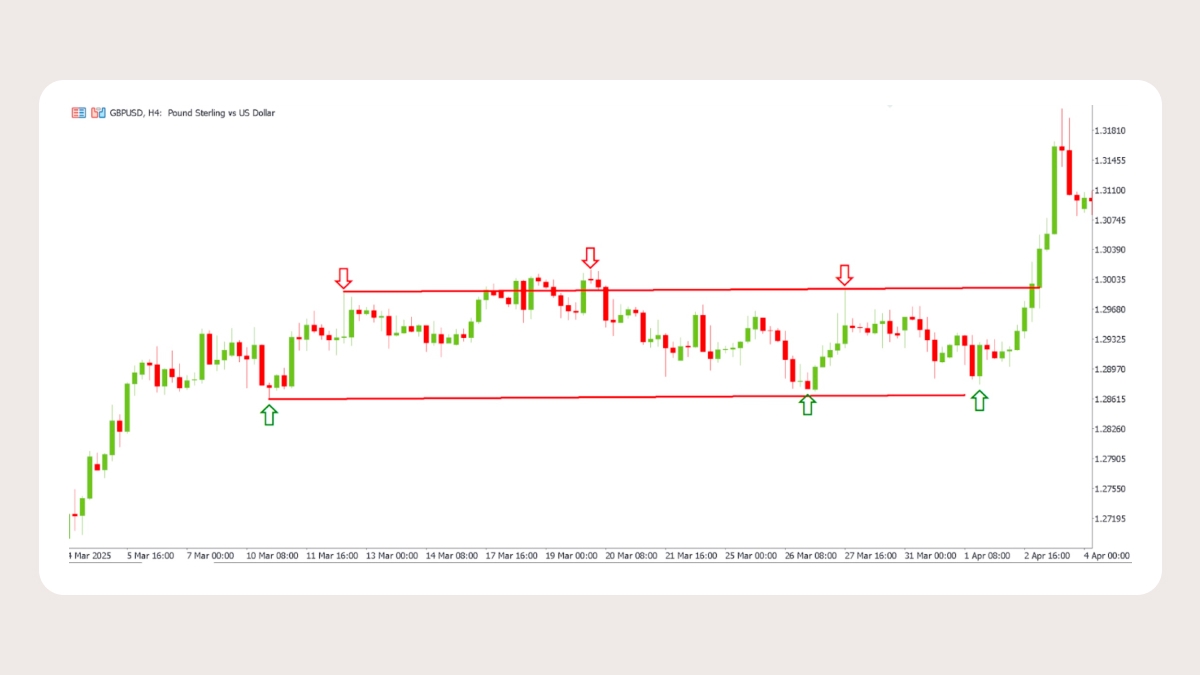
This GBPUSD H4 chart shows a clear range. Red arrows mark flat swing highs at resistance and green arrows mark flat swing lows at support. Price moves back and forth between these levels until a clean close above resistance breaks the range and starts the rally.
Trading strategies using swing points
Clear swings give you a plan. Use them to trade a break and retest or to join a trend on a pullback. The goal is simple. Buy where buyers stepped in before, or sell where sellers took over, and always manage risk around the same levels.
Break and retest strategy
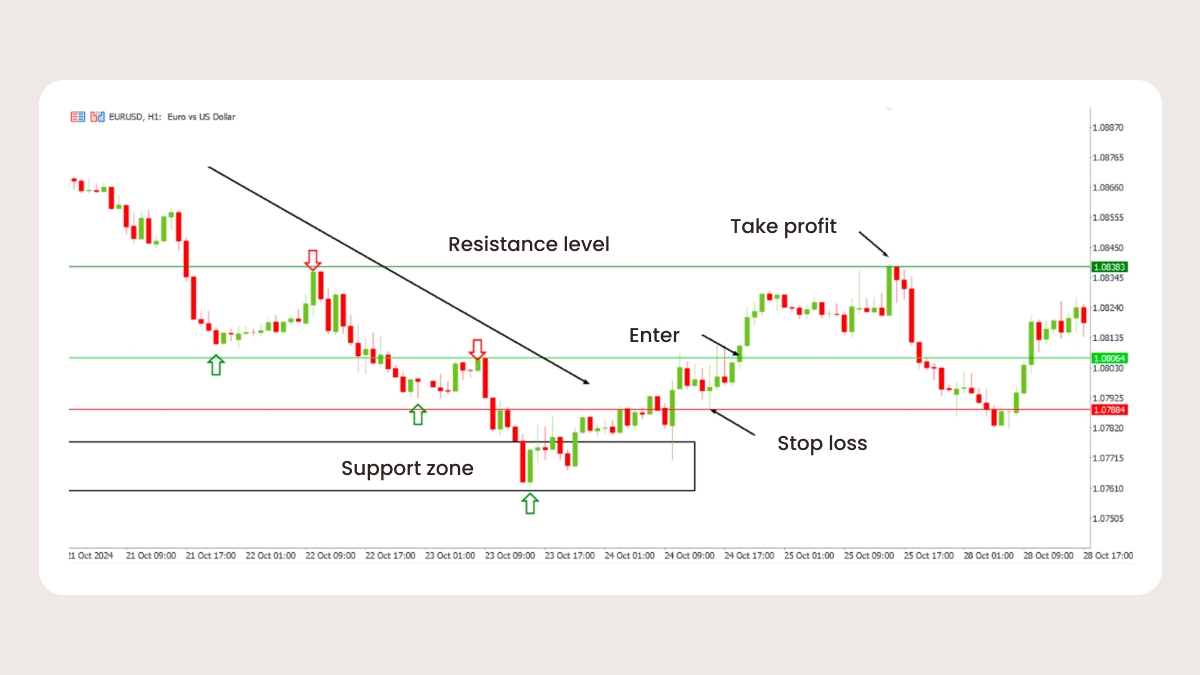
First mark a key swing high that acts as resistance or a key swing low that acts as support. Wait for a close beyond that level so you know the breakout is real. Then watch for the price to retest the same area from the other side.
If a prior swing high breaks and the price retests it from above, you can place a buy limit at that level. Set your stop a little below the retest and aim for the next resistance. If a prior swing low breaks and the price retests it from below, you can place a sell limit at that level. Place your stop just above the retest level and target the next support.
Keep the plan simple. Let the close confirm the break. Let the retest confirm the level. Enter only if the price stalls or turns away from the zone, and always size the trade so a full stop is a small part of your account.
Trend continuation with swing pullbacks
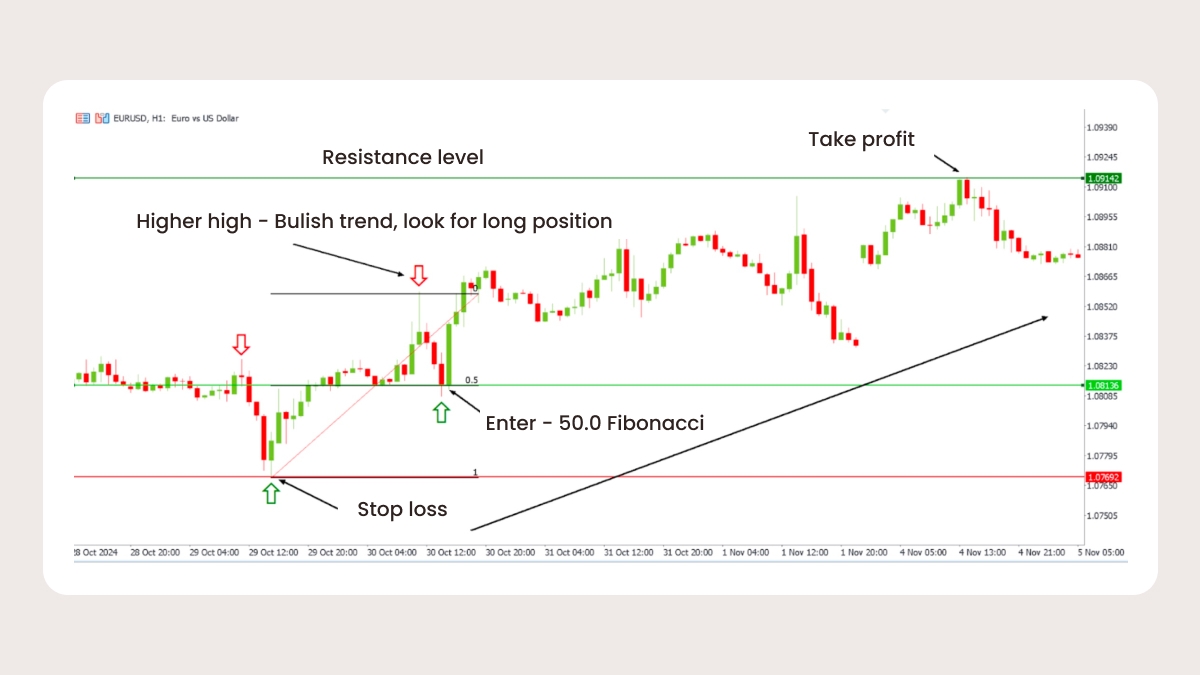
In an uptrend the market climbs in steps. Buy at higher lows that form above prior support. In a downtrend the market falls in steps. Sell at lower highs that form below prior resistance.
Use a Fibonacci retracement to guide entries. Many traders watch the 0.5 and 0.618 levels when the price pulls back to a prior swing. If the price returns to that zone and shows a clear bounce away from it, the plan is simple. Enter with the trend, put the stop beyond the swing, aim first for the prior high or low, and hold the rest while the trend stays strong.
This approach keeps you trading with momentum. It avoids chasing new highs and new lows and focuses on clean pullbacks. When swings line up with your levels, timing gets easier and risk stays tight.
Swing high and low indicators
Manual spotting trains your eye, but tools can help. The ZigZag indicator filters small moves and highlights major swings. It updates as the price changes, so use it as a visual guide, not as a signal. The Fractals indicator is different. It places small arrows above and below candles to mark local highs and lows, which helps you scan a chart quickly.
There are also custom indicators for MT4 and MT5 that label confirmed pivots after a set number of candles. You can tell the tool to wait for a certain count so only strong swings show. This removes extra marks and keeps your chart clear.
Remember what these tools do. They show structure. They do not tell you when to buy or sell. Use them with simple filters like RSI or price action. An RSI turn from oversold at a swing low helps a long idea. A bearish candle at a swing high helps a short idea.
When in doubt, let the chart stay simple. Draw swings by hand first, then add a tool if you need clarity. Less noise means better focus and fewer random trades.
Limitations and common pitfalls
Timeframe context matters. A swing low on a five-minute chart can mean nothing on a four-hour chart. Always check a higher timeframe to see the bigger trend before you act on a lower one.
Breakouts need confirmation. A swing is not broken until a candle closes beyond it. Ignore the thin lines above or below the candle and any quick spikes within the same bar. A retest makes the level stronger and reduces false moves.
Chasing every swing is a mistake. Some swings form in thin sessions and fade fast. Others sit in the middle of a range where the price has no clear path. Wait for swings at useful places such as prior highs, prior lows, and clean supply or demand zones.
Finally, manage risk first. Place stops beyond the swing that validates your idea. Do not move a stop unless the market gives you a new swing to protect the trade. Small, steady risk keeps you in the game long enough to let structure do its work.