FBS turns 16

Unlock birthday rewards: from gadgets and dreams cars to VIP trips.Learn more
Open account
Open accountLog In
Open account

July 28, 2025

Strategy

Trendline in Forex Trading: Types and How to Draw Them

Trendlines in Forex Trading

Trendlines are one of the easiest tools to use in Forex trading, and they really work! While many traders rely on complex indicators, trendlines help you see the direction of the market in a visual way. But how do they work exactly? And what is the right way to use them?

In this quick and easy guide, you’ll find out what trendlines are, the main types traders use, and how to draw them step by step to help improve your trading decisions.

What is a trendline?

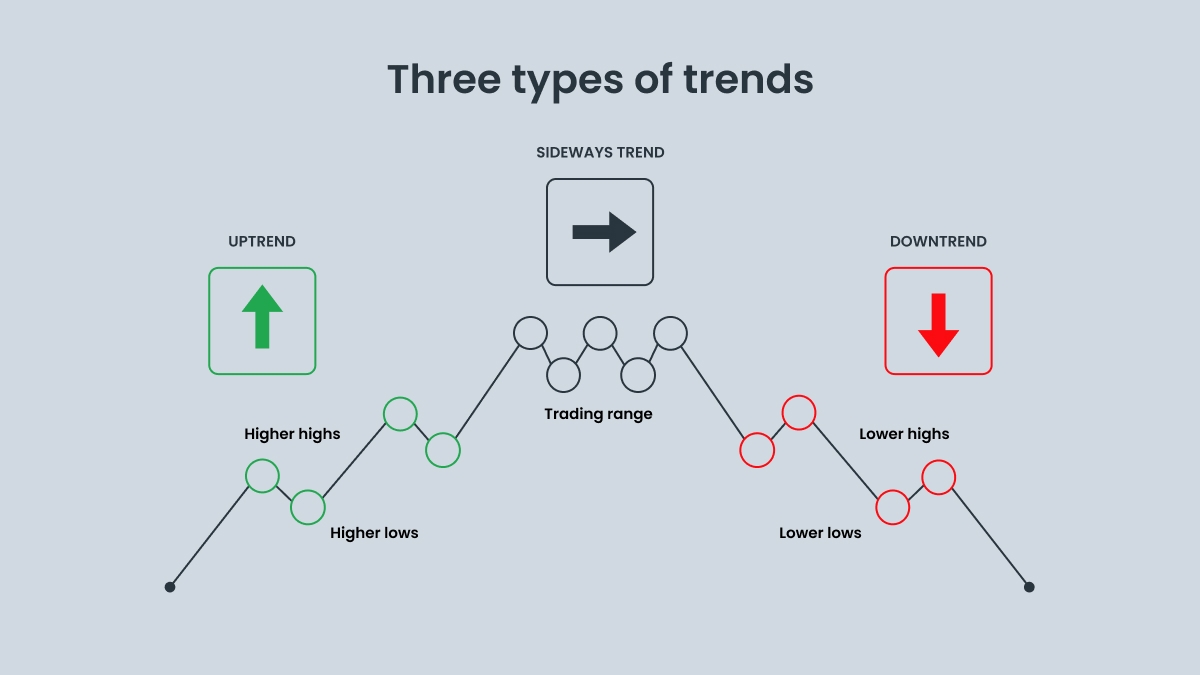
You’ve probably seen traders draw lines across charts. But what do those lines mean? A trendline is a visual tool that connects the most important points where the price has gone up or down. This line helps show which way the market is moving (up, down, or sideways).

But there’s more to them than just showing a direction. They also help you understand how strong or fast a trend is. And they often act as support or resistance (which means when the price gets close to the line, it might bounce off or break through).

Drawing a good trendline is all about reading the story behind price movement. A well-drawn trendline can also help you:

  • Spot the market trend (bullish or bearish).

  • Find possible reversals.

  • Choose better entry and exit points.

Why trendlines still matter

Even with all the fancy tools out there, trendlines are still one of the most important things a Forex trader can use. Just one well-drawn trendline shows you something different from complicated indicators: real price structure. No matter if you’re looking at a 1-hour or daily chart, trendlines help you see where the price followed the trend and where it started to slow down. They’re simple, but super powerful.

Trendlines make price action easier to understand, so you can plan better entries, exits, and manage risk with more trading confidence.

That’s why so many traders — new and experienced — still use trendlines. They help you focus on what really matters: how the price is moving. Once you learn how to draw them, trendlines can guide your trades.

Ready to try drawing your own trendlines? Open your demo account and start practicing today.

Types of trend lines

So, we’ve covered what trendlines are — now it’s time to explore the three most common types of trend lines used in Forex trading:

TypeWhat it showsWhat it tells tradersHow it helps traders

Uptrend line

(bullish)

Connects the low points where the price dropped but didn’t fall as much as before. Each new low is higher than the last one.Buyers are in control and prices are rising.Helps traders see when it might be a good time to buy.

Downtrend line

(bearish)

Connects points where the price went up but didn’t go as high as before. Each new high is lower than the last.Sellers are in control and prices are falling.Helps traders spot good times to sell.

Sideways line

(horizontal)

Connects similar highs or lows. Price moves in a range without a strong trend.The market is moving sideways.Helps traders watch for possible breakouts or see if the price will stay in the range.

How to draw trend lines correctly

Knowing how to draw trend lines is a key part of any Forex trading strategy. With that in mind, we’ve put together these simple steps to help you keep it clear:

  1. Find the trend. Start checking if the market is going up, down, or moving sideways.

  2. Connect two big highs or lows. For an uptrend, connect two low points (dips). For a downtrend, connect two high points (peaks). If the price touches the line a third time, that makes it even stronger.

  3. Use the same time frame. Stick to one chart time for better results. Higher time frames usually give more reliable trendlines.

  4. Pick your style. Some traders use candle closes for a cleaner line. Others use wicks to catch price extremes.

  5. Extend your line forward. After you draw it, stretch it into the future to spot where price might bounce or break.

Adjust if needed. Markets change. If a new high or low shows up, it’s okay to tweak your trendline.

Use a log scale on long-term charts. If the price moves a lot, switching to a log scale helps keep your trendline accurate.

Examples of trendline patterns

Examples of trendline patterns

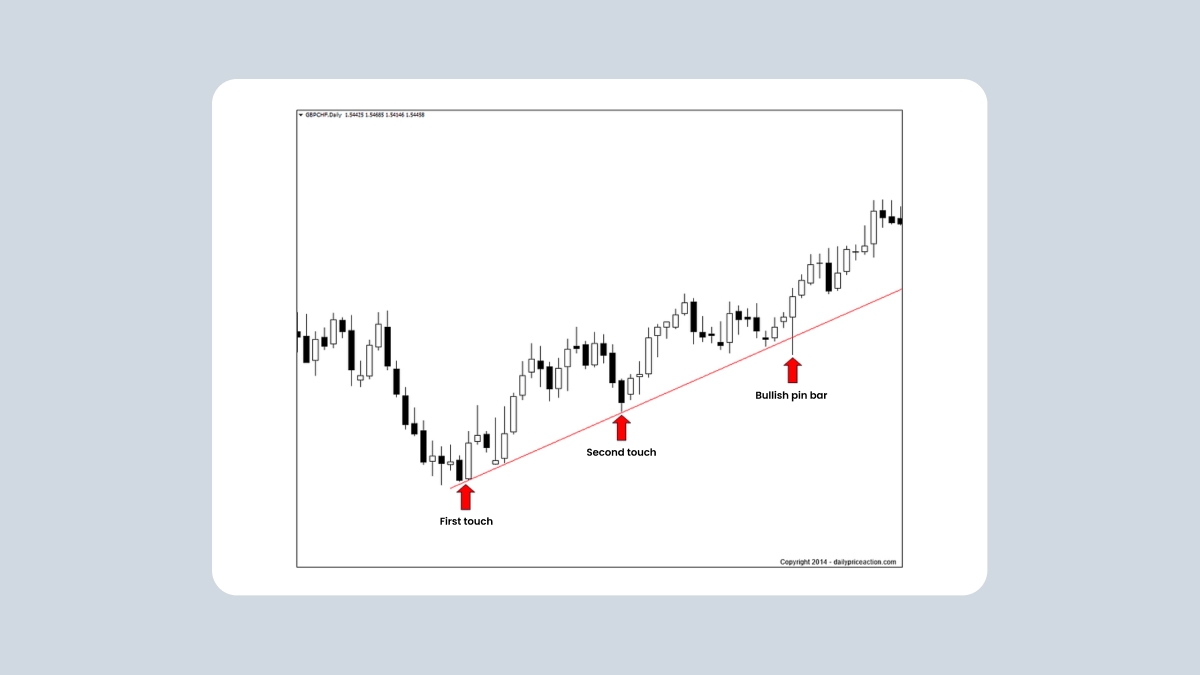
Here’s a simple example with the GBPCHF pair. The price touched the trendline two times, then came back and formed a bullish pin bar right on the line. This was a sign that buyers were still in control, and the trendline was working as support.

This is a strong setup: the trendline shows the market structure, and the pin bar confirms the price action. When both signals appear together, it’s often a good time to enter a long buy trade.

This setup works best when the trendline has already been tested a few times and the candle pattern is clear.

Common mistakes when using trendlines

Many traders make simple mistakes when using trendlines, and those mistakes can lead to bad trades. Here are some of the most common ones to watch out for:

  • Drawing through the candles. Your trendline should connect the wicks or the closing prices, not cut through the middle of the candles.

  • Forcing the line to fit. Don’t adjust the line just to make it fit your idea. A good trendline follows the real price movement. Let the price guide you.

  • Ignoring the time frame. A trendline that looks strong on a 1-hour chart might not matter on a daily chart. Always check higher time frames to get the full picture.

  • Constantly redrawing the line. If you keep changing your trendline all the time, it stops being helpful. Only change it when the market really gives you a good reason.

  • Thinking trendlines are always exact. Trendlines are a tool, not a guarantee. Combine them with other tools like support/resistance levels and indicators for better results and lower investment risk.

Summing up

Trendlines are still one of the most useful tools in a Forex trader’s toolbox. They may look weak and too simple to be useful, but drawing good trendlines is a powerful strategy.

Like anything, learning to use them the right way takes trading discipline and practice. One trendline won’t make you profitable, but knowing how to spot market structure and noticing when it breaks, can give you a real edge.

When a trendline gets tested several times, it means other traders are likely watching it too. That makes any breakout more meaningful. And when you combine a trendline with something like RSI or a strong candlestick pattern, you’re not just guessing — you’ve got a solid trade setup.

Ready to try this out? With the broker FBS, you get an easy-to-use platform and all the tools you need to trade with confidence.

Share with friends:

Open an FBS account

By registering, you accept FBS Customer Agreement conditions and FBS Privacy Policy and assume all risks inherent with trading operations on the world financial markets.

FBS at social media

iconhover iconiconhover iconiconhover iconiconhover icon

Contact us

iconhover iconiconhover iconiconhover iconiconhover icon
store iconstore icon
Get on the
Google Play
store iconstore icon
Get MT4 on the
App Store
store iconstore icon
Get MT5 on the
App Store

Trading

Company

About FBS

Our social impact

Legal documents

Company news

FC Leicester City

Help Center

Partnership programs

The website is operated by FBS Markets Inc.; Registration No. 000001317; FBS Markets Inc. is registered by the Financial Services Commission under the Securities Industry Act 2021, license number 000102/31. Office Address: The Bentley, #16 Cor A Street & Princess Margaret Drive, Belize City, Belize.

FBS Markets Inc. does not offer financial services to residents of certain jurisdictions, including, but not limited to: the USA, the EU, the UK, Israel, the Islamic Republic of Iran, Myanmar.

Payment transactions are managed by HDC Technologies Ltd.; Registration No. HE 370778; Legal address: Arch. Makariou III & Vyronos, P. Lordos Center, Block B, Office 203, Limassol, Cyprus. Additional address: Office 267, Irene Court, Corner Rigenas and 28th October street, Agia Triada, 3035, Limassol, Cyprus.

Contact number: +357 22 010970; additional number: +501 611 0594.

For cooperation, please contact us via [email protected].

Risk Warning: Before you start trading, you should completely understand the risks involved with the currency market and trading on margin, and you should be aware of your level of experience.

Any copying, reproduction, republication, as well as on the Internet resources of any materials from this website is possible only upon written permission.

The information on this website does not constitute investment advice, a recommendation, or a solicitation to engage in any investment activity.