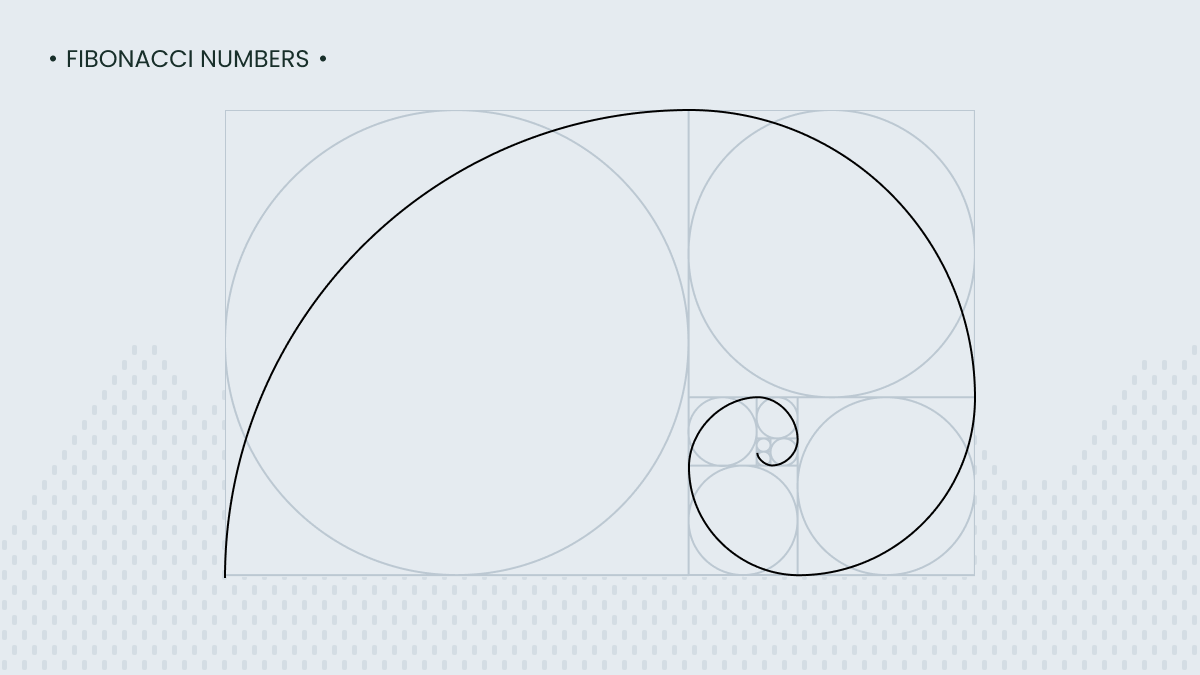
The Fibonacci Sequence is a sequence of figures starting with 0 and 1, where each number is the sum of the two previous ones: 0, 1, 1, 2, 3, 5, 8, 13, 21, and continuing infinitely. The Fibonacci Sequence is not just an abstract mathematical concept, it is a common pattern in many areas of life and manifestations of nature. The arrangement of leaves on a stem, the branching of trees, the spirals of shells, and even the breeding patterns of rabbits are only a small handful of examples of the Fibonacci sequence in the natural world.
The history of the Fibonacci Sequence
In 1202, a mathematician in the then independent city-state of Pisa (where the Leaning Tower did not yet exist then), named Leonardo Bonacci published what would become a very influential book: Liber Abaci. This treatise, full of practical illustrations of mathematical concepts, would lead to the adoption of the Arabic numeral system in the West.
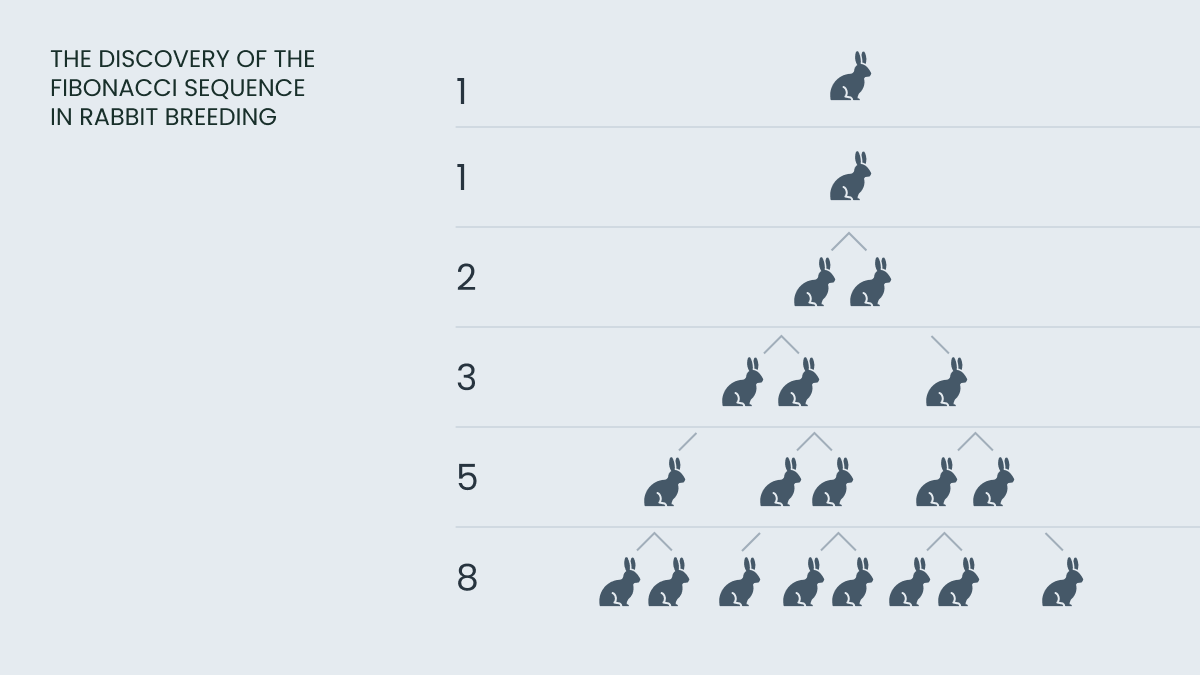
Among the novelties introduced in Liber Abaci was a sequence of numbers long known in India, which is often observed in nature, art, architecture, and even the movements of financial markets. Bonacci presented it as an example about rabbit breeding.
When Bonacci became known as Fibonacci (son of Bonacci), his famous sequence came to be the Fibonacci Sequence.
The Fibonacci Sequence in rabbit breeding
If you’re still finding your feet with trading tools and platforms like MetaTrader, our video tutorials are a good place to start. They cover the basics, from placing your first trade to using key technical features, so you can get comfortable with the process before diving deeper.
Fibonacci number templates and formulas
The Fibonacci Sequence can be calculated by the formula:
Fn = Fn – 2 + Fn – 1
where F0 = 0, F1 = 1, and n ≥ 2 and is an integer.
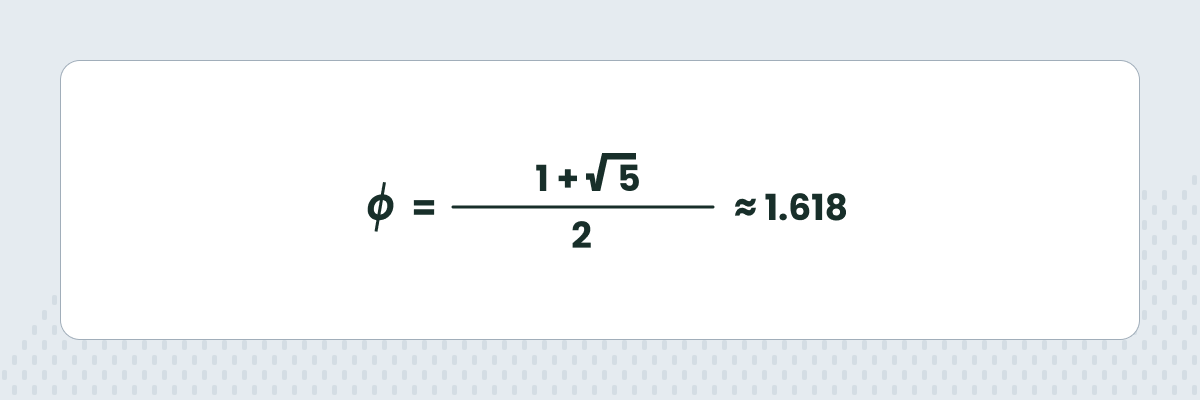
As the sequence progresses, the ratio of successive Fibonacci numbers tends to approach the Golden Ratio.
Golden Ratio / Phi (φ)
The Golden Ratio, often symbolized by the Greek letter φ (phi), is an irrational number approximately equal to 1.618033988749895. The Golden Ratio is calculated as:
Other patterns in the Fibonacci numbers
Every third Fibonacci number is a multiple of 2, every fourth is a multiple of 3, and every fifth is a multiple of 5.
Fibonacci numbers contain the pattern where, modulo 10, the last digits repeat every 60 numbers.
Using the Fibonacci numbers in stock trading
In stock trading, Fibonacci number patterns are often used to predict future price movements based on an asset’s previous performance. Traders apply the Fibonacci system to identify potential reversal or retracement levels (where the price may pull back before continuing in the original direction). Based on key Fibonacci ratios derived from the sequence, these retracement levels may be deviated from to some degree, depending on a trader’s experience.
This article is a summary of stock trading in China. It explores the factors that caused the Chinese stocks to drop, assesses the impact of rapid policy changes, and considers the risks and potential future of investing in the Chinese stock market.
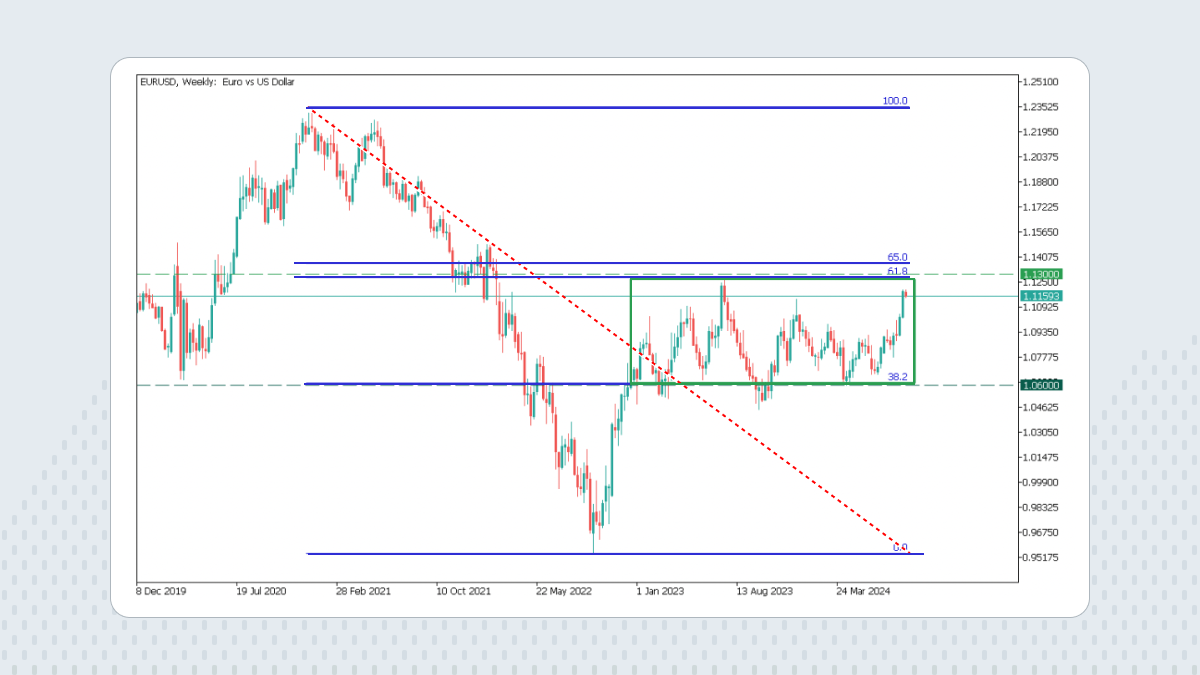
Fibonacci retracement levels
Traders use the Fibonacci Sequence to figure out where support and resistance levels will be. These points are where price retracements are likely to occur - a dip before a continued rally upward, or a spike before a continued plunge.
The Fibonacci ratios used to find these retracement levels are usually 23.6%, 38.2%, and 61.8%.
The price ranges between 38.2% and the Golden ratio.
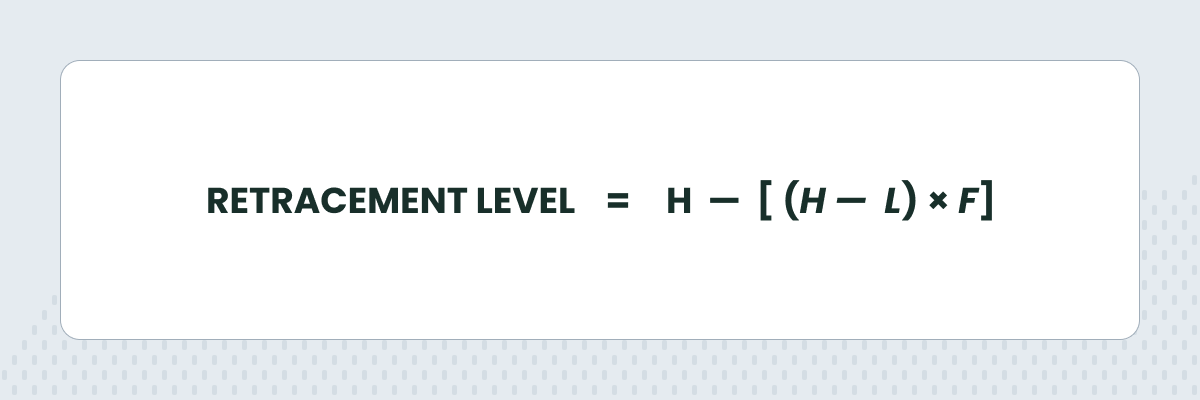
The Fibonacci retracement level formula
Fibonacci retracement levels in trading are calculated by taking two extreme points (usually a high and a low in the price) and dividing the vertical distance between them by the key Fibonacci ratios in percentages of 23.6%, 38.2%, 50% (added to the sequence due to its long history as a retracement level), 61.8%, and 100%.
Where:
H = The high point of the price movement.
L = The low point of the price movement.
F = The Fibonacci level (commonly 0.236, 0.382, 0.500, 0.618, 0.764).
How to apply Fibonacci retracement levels on charts
To use Fibonacci retracement levels on a chart, identify a significant price movement — either up or down — and plot the key Fibonacci levels over the price action. Draw a line from the swing high to the swing low for a downtrend, or from the swing low to the swing high for an uptrend. The resulting Fibo lines on the chart represent potential levels of support or resistance.
How to trade using Fibonacci retracement
To use Fibonacci retracement levels correctly, traders look for potential reversal zones. For example:
In an uptrend: Traders may look for buying opportunities near the 38.2% or 61.8% retracement levels.
In a downtrend: Traders might consider shorting the market after rebounding off the retracement level.
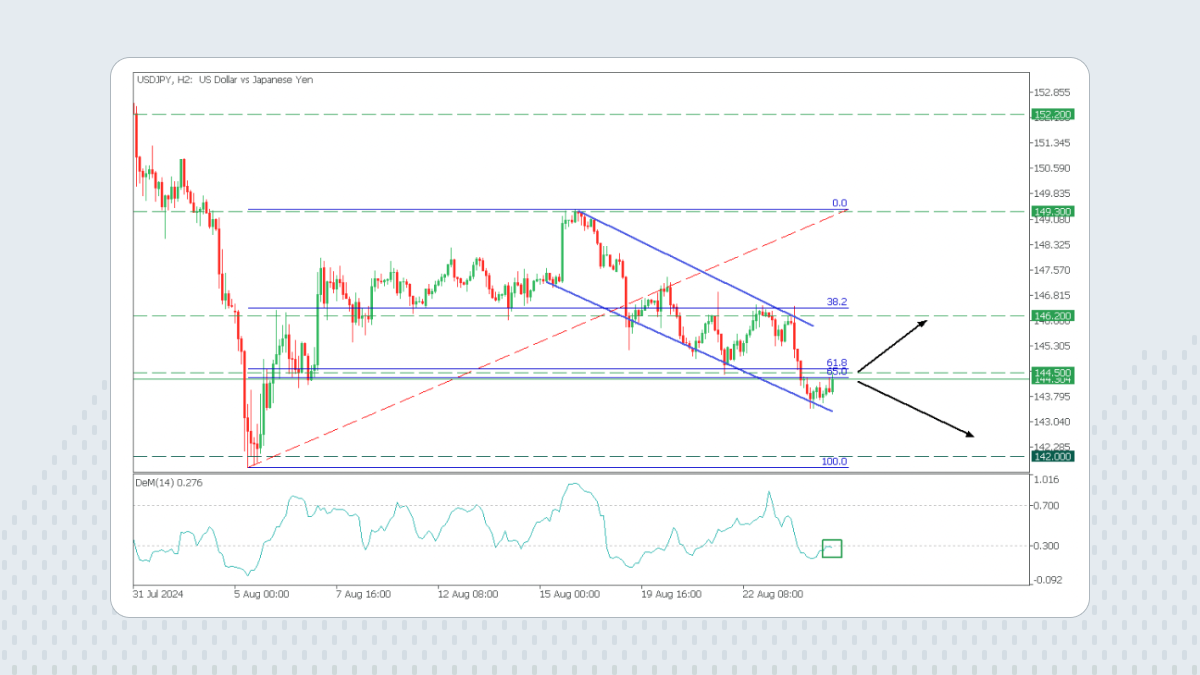
There is a strong Fibonacci zone at 61.8% and 65.0%, called the golden ratio. The market often reacts to this significant zone.
The strategy usually involves entering a trade when the price shows signs of reversаl near one of these levels, and plаcing stop-losses just beyond the next retrаcement level to minimize risk. However, it is better to use Fibonacci levels as a strategy in conjunction with other indicators or technical analysis metrics.
Placement of stop-loss and take-profit
When trading with Fibonacci retracement, stop-losses are usually placed just beyond the next Fibonacci level. For instance, if entering a trade at the 61.8% retracement level, a stop-loss could be placed just below the 76.4% level or the previous high/low.
Take-profit levels can be set at the previous high or low (depending on the trend direction) or at key Fibonacci extension levels such as 127.2% or 161.8% beyond the initial price move, etc.
Combining Fibonacci retracement with other tools
Fibonacci retracement must be used in conjunction with other technical analysis tools like moving averages, trendlines, candlestick patterns and oscillators like the RSI (Relative Strength Index), Momentum, MACD, etc
An example of analytics featuring the Fibonacci retracement and other tools of technical analysis
The H1 and H4 charts serve as the battlegrounds for those seeking to capitalize on intraday opportunities. This article delves into the nuances of short-term trading strategies on these dynamic charts, unveiling the most demanded strategy for success in this fast-paced arena.
For example, if a Fibonacci retracement level coincides with a moving average or a trendline, it strengthens the likelihood that the level will hold and act as support or resistance.