Ask three simple questions before you trust a zone:
Did it break market structure?
Did it create fear or excitement on the chart?
Did volume spike when it formed?
If the answer to any of these questions is no, the zone is probably just noise. Focus on zones that change the story on higher-time-frame charts and skip tiny pauses in the middle of a range.
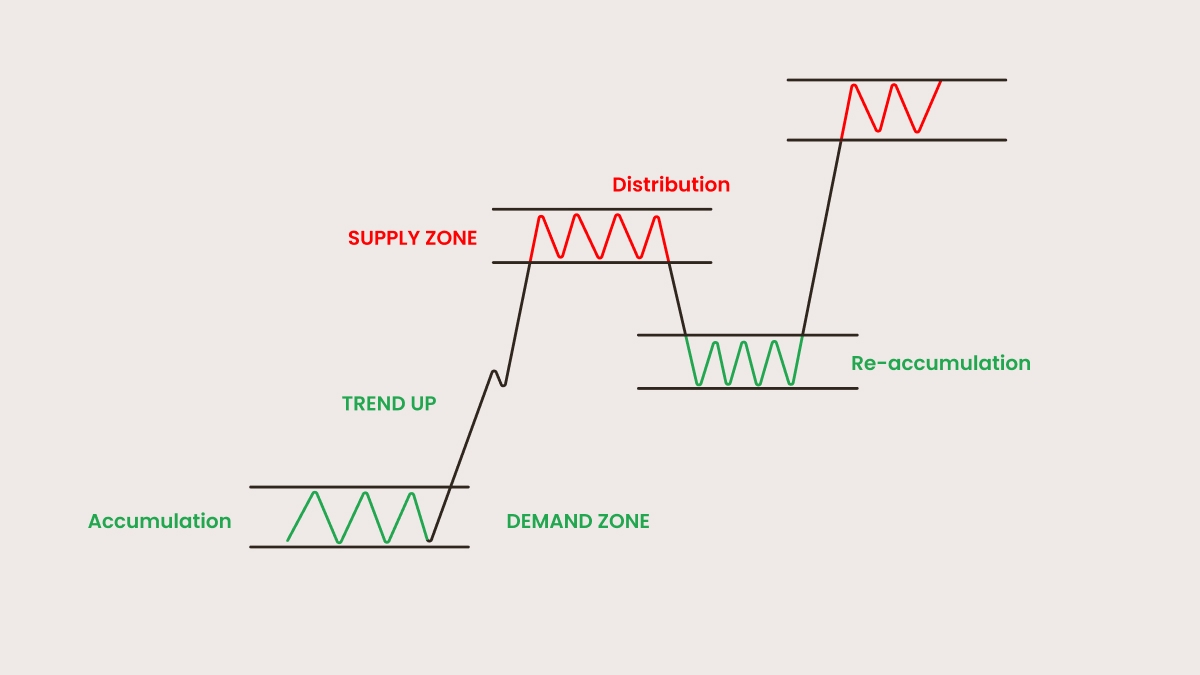
Supply and demand patterns
Four basic patterns help traders spot where the price might turn or keep moving. Each pattern has a simple name that describes what the candles do on the chart.
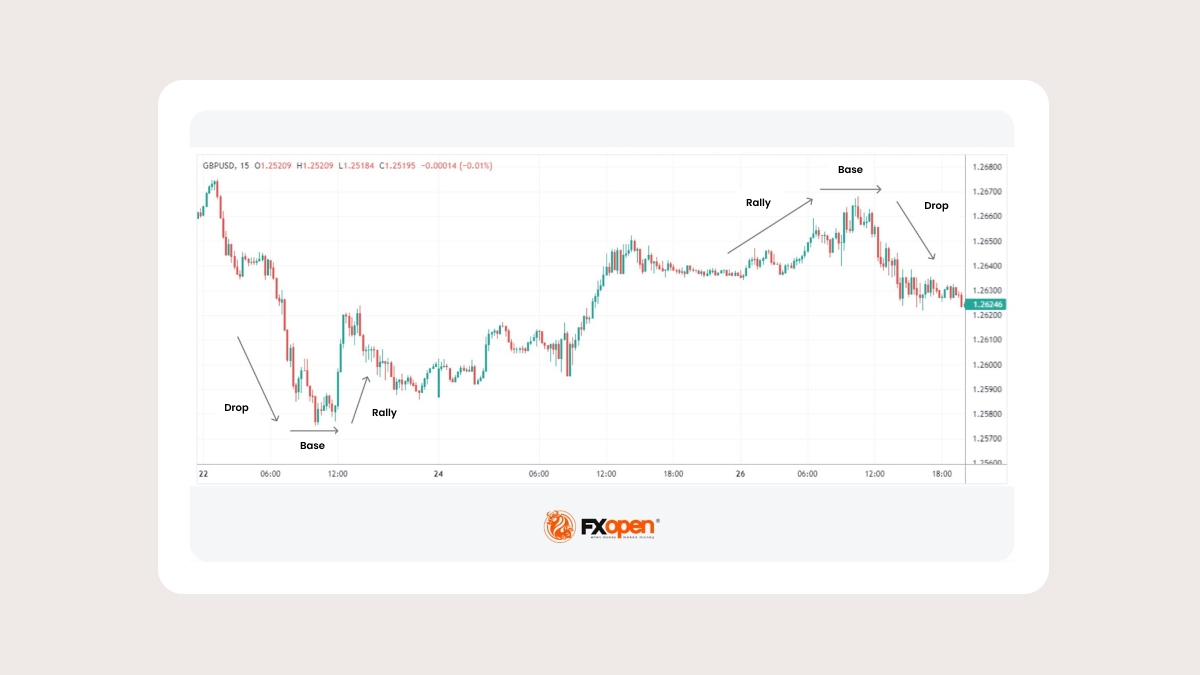
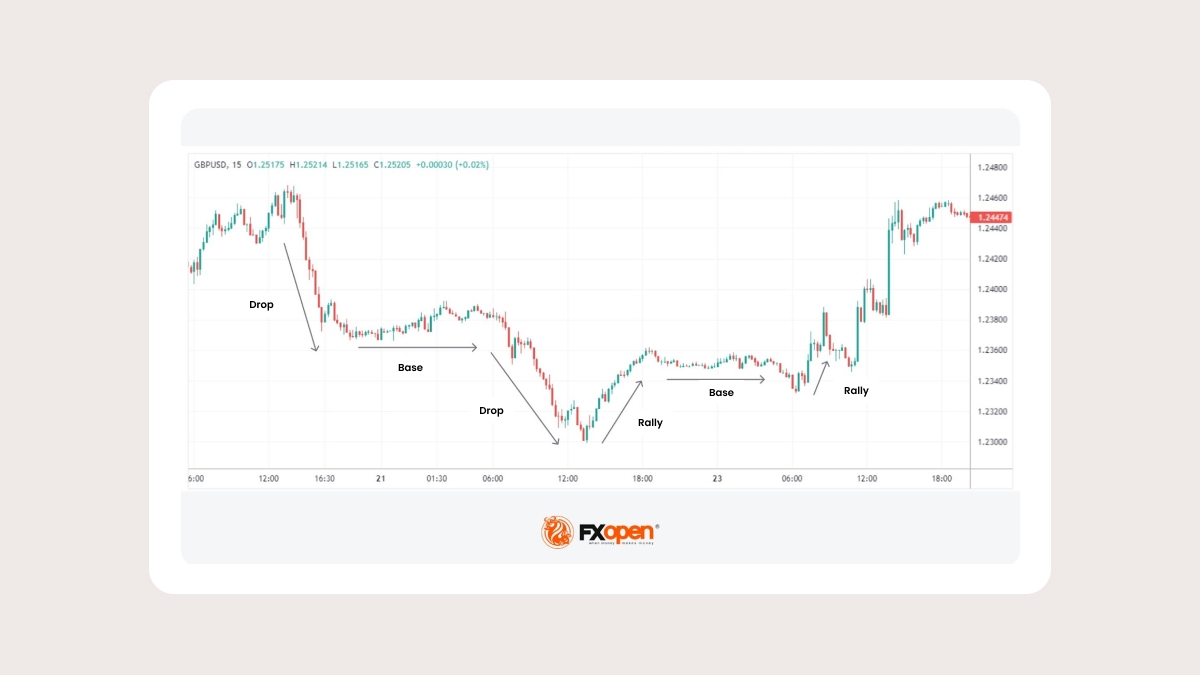
Drop-Base-Rally (DBR). The price drops sharply, pauses in a small box, then shoots up. Sellers look tired and buyers jump in with large orders. Many traders go long on the first clean retest of the base.
Rally-Base-Drop (RBD). The price climbs fast, stalls, and then drops hard. Buyers run out of energy and sellers take charge. Late buyers get trapped, so fresh shorts on the pullback often work well.
Rally-Base-Rally (RBR). The price rallies, pauses, and rallies again. Steady demand keeps pushing higher. Traders look to buy if the price returns to the base while the broader trend stays up.
Drop-Base-Drop (DBD). The price falls, pauses, then falls again. Persistent selling shows that bears control the market. Short trades in line with the move make sense, especially when the zone is still clean and untested.
Timeframes best suited for supply and demand trading
Supply and demand trading is easiest when you read the chart like a map. Start with a wide view to see where the big orders are, then zoom in to plan the exact entry. Each timeframe has a clear job in this top-down process.
1. Map the structure — 4H/1H
Use the four-hour or one-hour chart to spot strong zones. These levels form after many candles, so they carry more weight than quick swings on lower charts. Mark every clean zone here before you move on.
2. Confirm the reaction — 1H/15m
Drop to the one-hour or fifteen-minute chart to watch how the price reacts. Look for long wicks, sharp rejections, fake breakouts, or clear absorption. These signs tell you that buyers or sellers are still defending the zone.
3. Time your entry — 15m/5m
Finally, to execute, switch to the fifteen-minute or five-minute chart. Wait for a reversal candle, a sudden volume shift, or another clear trigger. Keep stops tight and targets realistic.
The table below sums up this workflow so you can match each timeframe to its main role and the signals to look for.
| Timeframe | Role | What to Look For |
| 4H/1H | Structure/map | Strong supply & demand zones |
| 1H/15m | Reaction/confirmation | Wicks, rejections, fakeouts, absorption |
| 15m/5m | Execution/entry timing | Reversal candle, volume shift, sniper stop-loss |
Trading strategy using supply and demand zones
Trading with supply and demand focuses on clear levels where buyers or sellers showed real strength. The key is to watch how a price leaves a zone. A strong exit hints at trend continuation, while a weak exit may signal a reversal. Once you know which side holds power, you can plan an entry when the price comes back to retest the zone.
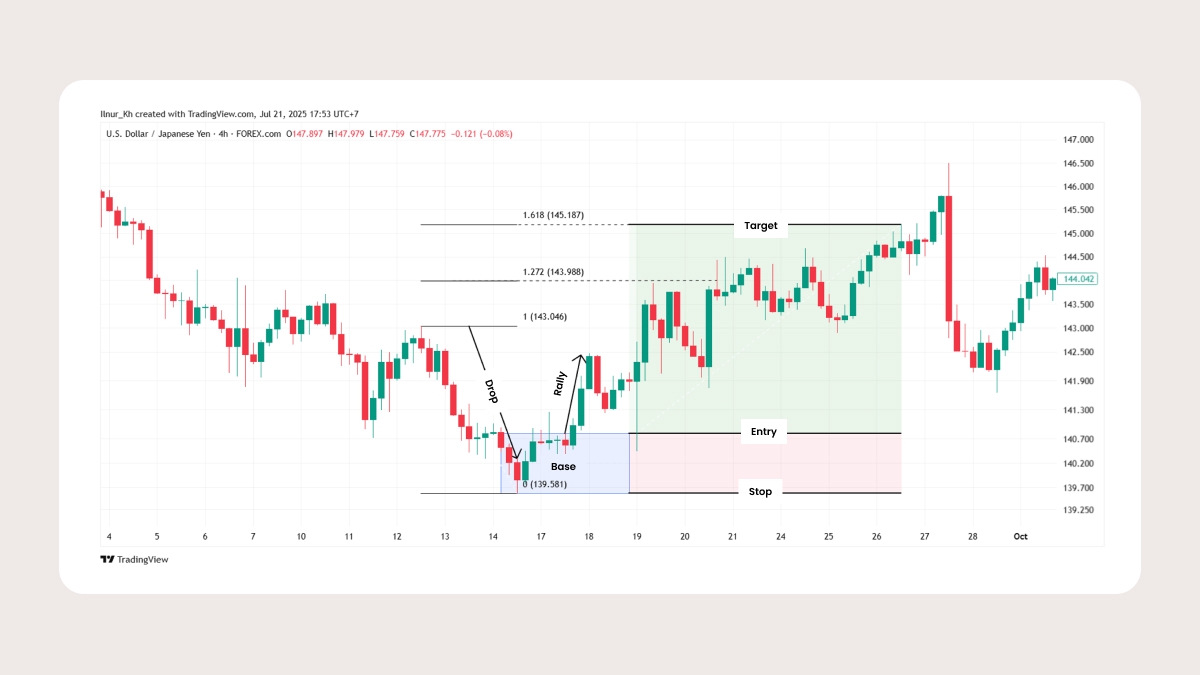
Example: Drop-Base-Rally (DBR)
The price drops quickly, pauses in a tight base, and then rallies hard. The pause becomes a demand zone because buyers absorb every offer there. After the breakout, the price often returns with a quick wick, giving you a chance to set a buy-limit order inside the zone. Place your stop just below the lowest wick to protect against a deeper sweep.
For targets, use a Fibonacci tool on the rally leg. Aim first at the 1.272 extension, and extend to 1.618 if momentum stays strong. This setup works best in a trending market or right after major news, when fresh energy can push the price cleanly in your favor.
Risks, limitations, and misconceptions
Supply and demand zones offer a clear map, but they are not a guarantee. A price may respect a zone once and ignore it the next time, especially after several retests have eaten up the resting orders.
Many traders fall into the same traps. They trade every zone the moment a price touches it, even during the quiet Asian hours when volume is thin. Others buy a demand zone in a strong downtrend, or assume the zone is an exact line instead of a broad area.
A zone only shows where large orders might await. Whether it holds depends on fresh order flow, market news, and the broader trend. A zone marks where the price may react, as it rarely stops at a precise point.