Open account
Open accountLog In
Open account

Aug 19, 2025

Strategy

What is the Three Black Crows Pattern?

In this article

Three Black Crows Candlestick Pattern

A sudden line of three long red candles can flip trader sentiment from calm to cautious. The Three Black Crows pattern typically appears after a sharp rise. Each candle opens within the previous candle’s body and closes near its low, indicating persistent selling. When this pattern appears, buyers are losing ground, and a deeper slide may follow.

What is the Three Black Crows candlestick pattern?

The Three Black Crows pattern is a bearish reversal signal made of three straight bearish candles. It is the opposite of the Three White Soldiers, which signals bullish strength. Each candle opens inside the body of the one before it and then closes near its low, forming a clear stair-step lower. The structure usually forms at the top of an uptrend or near a key resistance zone. Sellers appear in force, pushing the price down session after session.

Because the candles close near their lows, buyers fail to lift the price by the end of each period. This steady pressure signals that sentiment is turning. Traders watch for the pattern at swing highs or after a long rally, where it often warns of a shift from demand to supply. Look for clear signs on the chart: long candle bodies, very small lower shadows, and three clean lower closes. These features prove that sellers will be in charge over several sessions, not just for one brief move.

A daily or four-hour chart gives the pattern more weight than a short-term chart. On many trading platforms these candles appear red instead of black, but the signal stays the same. Rising volume or an RSI drop below fifty offers extra proof that the new downtrend has room to continue.

What is the Three Black Crows candlestick pattern?

Key characteristics: pattern breakdown

To count as a true Three Black Crows, the pattern must have three bearish candles in a row. Each candle must open inside the real body of the one before it and then close lower, ideally near its low. Lower shadows should be small or absent, proving that sellers stayed in charge all period.

The pattern is most reliable when it forms after a clear uptrend or an overbought rally. It gains more weight if it appears at a resistance area or after a failed breakout. Rising volume during the three candles adds extra proof of strong selling. An RSI that shows bearish divergence or breaks below 50 reinforces the signal.

Long candle bodies show firm selling strength, while very short bodies suggest hesitation. If the third candle is much shorter than the first two, momentum may be fading and the pattern may lose reliability. Check the context: strong resistance, volume build-up, and momentum tools all make the formation more trustworthy.

Bearish significance: why it signals a reversal

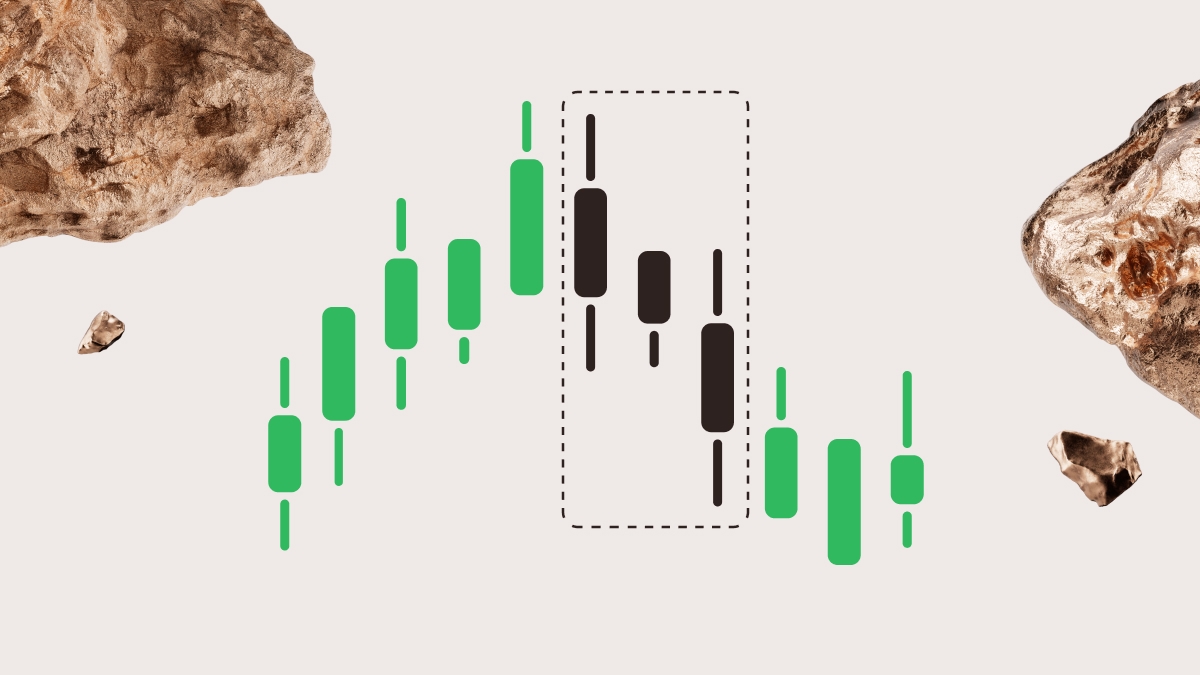
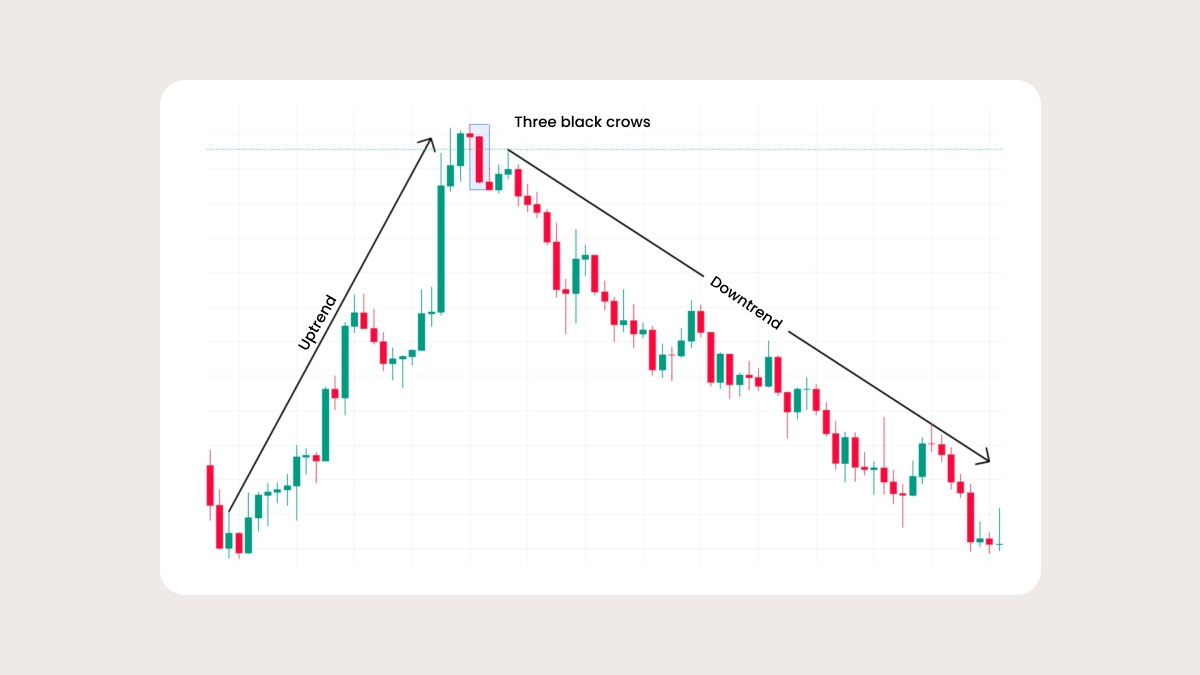
The Three Black Crows tell traders that buyers are no longer in charge. Bulls tried to keep the price up but failed three sessions in a row. Each close lower shows growing confidence among sellers.

When the pattern appears near a key resistance or major trendline, it can attract larger funds who see the shift early. The formation proves that bearish momentum is broad, not based on one candle. A chain of lower closes often marks the start of a deeper correction.

Traders read the pattern as evidence that buyers are overwhelmed, volume is shifting, and a downtrend may begin or an uptrend may pause. The signal acts as an early alert before indicators fully turn.

Why this matters:

  • Early warning. The pattern can show weakness before other tools flash bearish signs.

  • Volume confirmation. Higher volume across the three candles supports real selling, not profit-taking.

  • Risk clarity. The high of the first candle sets a clear place for a stop-loss.

  • Target planning. Traders can aim for the next support zone or a Fibonacci retracement for profit targets.

How to trade on the pattern

To trade on the Three Black Crows, treat the steps below as a checklist.

Context first

Check that the price has been rising or moving up sharply before the pattern forms. Look for major resistance, a round number, or an overbought RSI above seventy. A pattern that appears in the middle of a range is less reliable.

Volume check

Make sure volume grows from the first candle to the third. Rising volume shows real selling pressure. If volume stays flat or falls, the move may lack strength and fade quickly.

Confirmation tools

Add one more tool to confirm the shift. An RSI drop below fifty or an MACD bearish crossover both support the pattern. These tools help filter out weak signals.

Entry ideas

Choose the entry style that matches your risk tolerance.

  • Aggressive entry. Go short at the close of the third candle when both volume and a momentum tool confirm the shift.

  • Conservative entry. Wait for the price to break below the low of the third candle to prove follow-through.

  • Pullback entry. Let the price return to the midpoint of the third candle and enter short only if it stalls or rejects that level.

Stops and targets

Plan your exits before you click the button.

  • Stop-loss. Place the stop just above the high of the first crow to cap risk on a failed pattern.

  • Take-profit. Aim first for the nearest support zone or the 0.618 Fibonacci retracement of the prior rise. A fixed risk-to-reward of 1 to 2 also keeps the plan clear.

  • Trailing rule. After the price moves by the same distance as your initial risk, that is, it gains the amount you were prepared to lose, move the stop to breakeven (your entry price) or trail it above each new lower high to lock in gains.

Extra Filters

Avoid taking the setup just before major news because spreads can widen. Skip thin sessions such as the early Asia open. Keep a trade log to learn which entry style and filters work best for you.

Example of the pattern in real charts

Example of the pattern in real charts

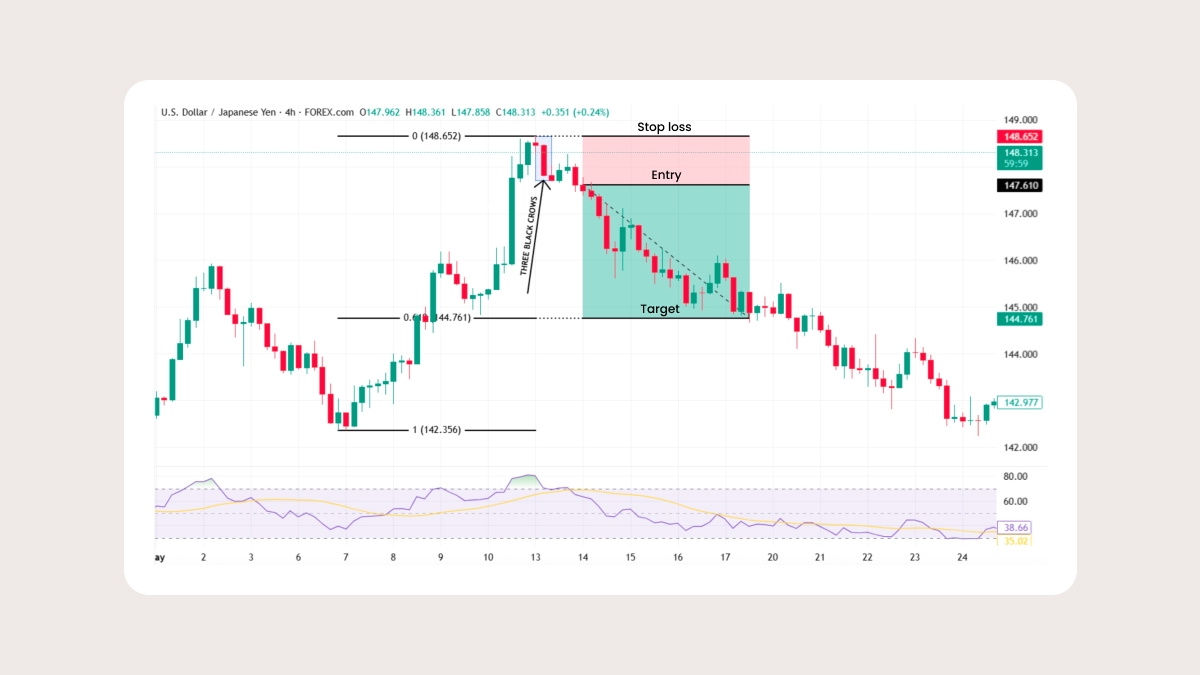
To see the pattern in action, look at a recent USDJPY four-hour chart. The price had climbed for days and stalled near a round number. The RSI moved above 70, showing an overbought market. Then three long bearish candles printed, each closing lower with almost no wicks.

A Fibonacci retracement from 142.356 up to 148.652 showed the 0.618 level near 144.761. Rising volume across the three candles confirmed real selling. When RSI slipped back under 70, a short trade opened at the next candle’s start. The stop-loss was placed just above 148.652, marking the top of the pattern.

Two sessions later the price touched 144.761, giving a clear one-to-two risk-reward result. The setup merged an overbought RSI, strong red candles, rising volume, and Fibonacci alignment for a well-defined trade.

Limitations and pitfalls to watch for

The Three Black Crows can mislead in a low-volume or slow market. The pattern may show up during a brief pullback inside a larger uptrend and fail soon after. If trading activity is light, sellers may not have enough force to push the price lower. Sudden news can also break the pattern minutes after it forms.

Extra warning signs include an RSI that stays above seventy, long lower shadows, or very small candle bodies. These features hint that selling pressure is weak. Avoid trading the setup by itself. Always review the higher-time-frame trend, confirm with volume and momentum tools, and mark the nearest support or resistance.

Check when major data releases are due and skip the pattern during holiday sessions or thin overnight trading. By adding these filters, traders protect themselves from false signals and lower the chance of entering a trade that quickly reverses.

Share with friends:

Open an FBS account

By registering, you accept FBS Customer Agreement conditions and FBS Privacy Policy and assume all risks inherent with trading operations on the world financial markets.

FBS at social media

iconhover iconiconhover iconiconhover iconiconhover icon

Contact us

iconhover iconiconhover iconiconhover iconiconhover icon
store iconstore icon
Get on the
Google Play
store iconstore icon
Get MT4 on the
App Store
store iconstore icon
Get MT5 on the
App Store

Trading

Company

About FBS

Our social impact

Legal documents

Company news

FC Leicester City

Help Center

Partnership programs

The website is operated by FBS Markets Inc.; Registration No. 000001317; FBS Markets Inc. is registered by the Financial Services Commission under the Securities Industry Act 2021, license number 000102/31. Office Address: The Bentley, #16 Cor A Street & Princess Margaret Drive, Belize City, Belize.

FBS Markets Inc. does not offer financial services to residents of certain jurisdictions, including, but not limited to: the USA, the EU, the UK, Israel, the Islamic Republic of Iran, Myanmar.

Payment transactions are managed by HDC Technologies Ltd.; Registration No. HE 370778; Legal address: Arch. Makariou III & Vyronos, P. Lordos Center, Block B, Office 203, Limassol, Cyprus. Additional address: Office 267, Irene Court, Corner Rigenas and 28th October street, Agia Triada, 3035, Limassol, Cyprus.

Contact number: +357 22 010970; additional number: +501 611 0594.

For cooperation, please contact us via [email protected].

Risk Warning: Before you start trading, you should completely understand the risks involved with the currency market and trading on margin, and you should be aware of your level of experience.

Any copying, reproduction, republication, as well as on the Internet resources of any materials from this website is possible only upon written permission.

The information on this website does not constitute investment advice, a recommendation, or a solicitation to engage in any investment activity.