Supertrend can also guide your stop. As long as price stays on the same side of the line, you keep the trade open. If the price closes on the other side of the line, you exit. This keeps the plan simple and helps you stay with the move.
Use Supertrend when the market is trending. In a sideways market it may switch too often and create noise. Combine it with price structure for stronger signals. For buys, look for breakouts and for higher highs and higher lows. For sells, look for lower highs and lower lows. Let the line give the signal, and let structure confirm it.
Strategy Examples
Basic trend plan. Wait for a color change and a clear break in price structure. For a long, the line turns green and price makes a higher high and a higher low. Enter on the next clean close above the line and exit on the next color change or at a known resistance.
Supertrend with Fibonacci extension. Enter when the color changes in the direction of the new trend. Use the prior swing to draw Fibonacci extensions and set targets. Aim first at 1.272, then reach for 1.618 if momentum stays strong, so your targets and risk-to-reward are defined in advance.
Supertrend with a moving average. Use Supertrend for the signal and a moving average for confirmation. For longs, wait for a green line and price above the moving average like the 50 or the 200. For shorts, wait for a red line and price below the moving average. Trade only when both tools agree and stand aside when they do not.
Real-World Example
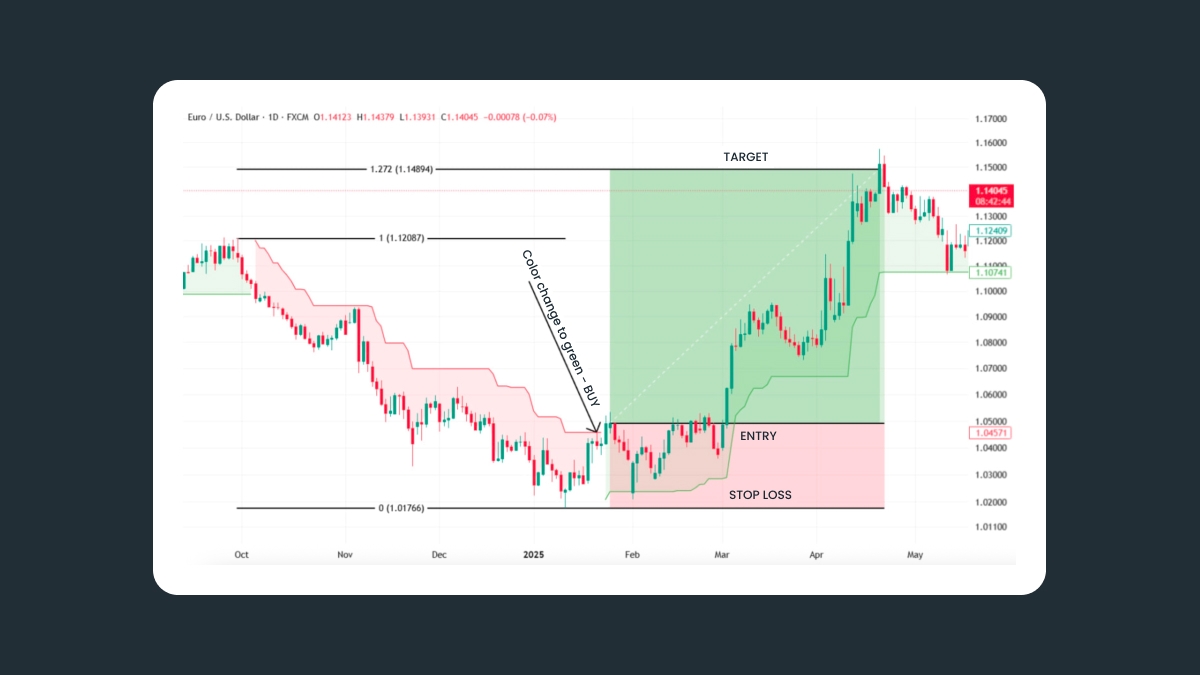
Look at EURUSD on the daily chart. Price had been falling, then it based and started to firm up. The Supertrend line changed from red to green. That was the first signal to look for a buy.
The entry came on the first clean close above the green line near 1.05. The stop loss went a little below the Supertrend line and the recent swing low around 1.02. This kept risk tied to current volatility and to the structure on the chart.
We drew Fibonacci from the swing low at 1.01766 to the swing high at 1.12087. The 1.272 extension showed a target near 1.14894. That target offered about three to one reward to risk, so the plan was clear before the trade.
Price stayed above the green line as the trend grew. Pullbacks were small and each dip held above Supertrend. You could trail the stop under the line as it climbed and lock in more profit as price advanced.
The move reached the 1.272 extension and hit the target. This example shows the full workflow. Supertrend gives the signal and the stop guide. Structure confirms the direction. Fibonacci sets a realistic target so you know the risk and the reward in advance.
This blend of trend, structure, and measured targets works well for swing trades on liquid pairs.
Setting Stops and Take Profits
Stops. Put the stop just beyond the Supertrend line. For a long, the line sits below price, so place the stop a little under it. For a short, the line sits above price, so place the stop a little over it. This keeps risk tied to current volatility.
Take profits. Choose the next swing high or swing low as a first target. You can also use Fibonacci levels from the last impulse, or set a fixed risk-to-reward such as 1 to 2 or 1 to 3. If the trend is strong, trail the stop along the Supertrend line to lock in gains.
Position sizing. Use position sizing based on ATR. When volatility rises, trade smaller. When volatility falls, trade a bit larger. This keeps your risk level consistent even as pairs speed up or slow down.
Limitations: Whipsaws and Ranging Markets
Supertrend struggles when price moves sideways. The line can switch colors many times and create false signals. It is safer to skip trades when price sits between clear support and resistance.