What is the Quasimodo pattern in Forex?
The Quasimodo pattern (QM) is a useful tool in Forex trading, as it helps traders find early entry points into emerging trends after a market reversal.
Aug 25, 2025
Strategy
The Quasimodo pattern (QM) is a useful tool in Forex trading, as it helps traders find early entry points into emerging trends after a market reversal.
A QM is a reversal pattern that signals the formation of a new trend after reaching a minimum or maximum. The structure of the Quasimodo allows you to accurately set the stop-loss and makes it possible to accurately record trend movements.
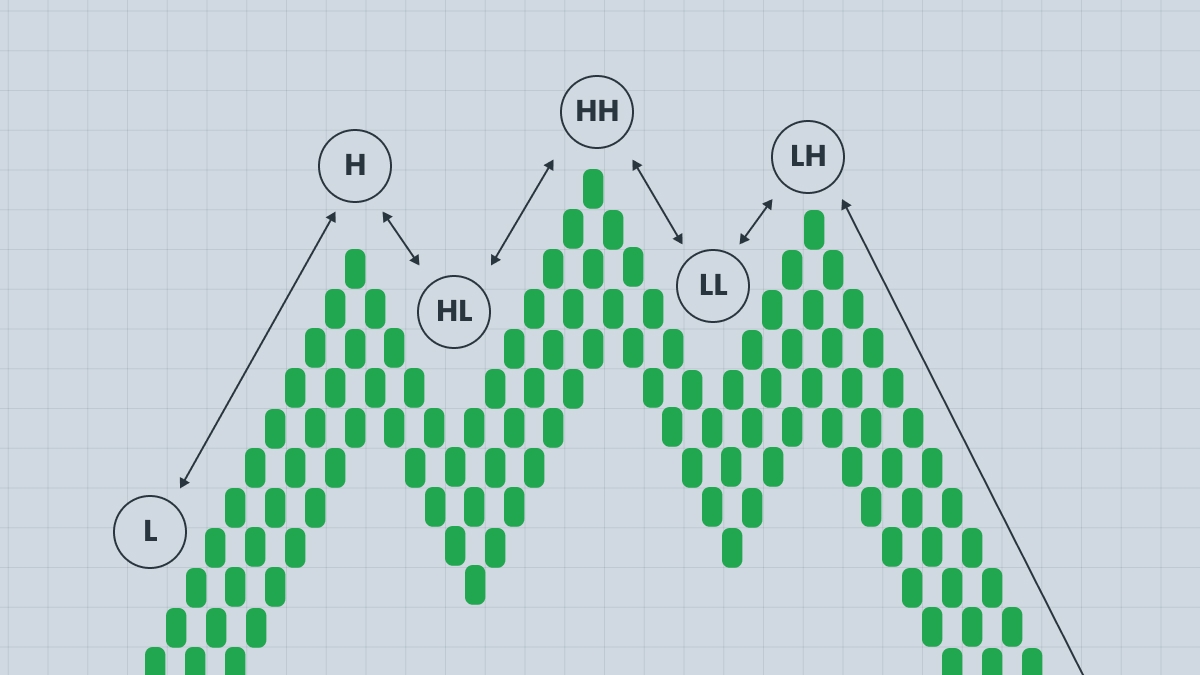
How do you identify the Quasimodo pattern on a chart? This pattern consists of three distinct peaks or equally distinct troughs, depending on whether the chart depicts a bearish or bullish scenario. The pattern is named after the character in Victor Hugo's novel because of the asymmetric nature of price movement.
There are five conditions for the formation of the Quasimodo pattern.
1. Formation of a lower low or higher high with a strong bearish or bullish trend.
2. A false breakout of the previous structure is formed. At first, it seems that it has been broken through, but then a pullback happens.
3. A sharp reversal confirms that the breakout has failed.
4. The test of the original zone occurs again, most often in those places where the breakout failed.
5. An entry trigger is formed when re-entering the base zone.
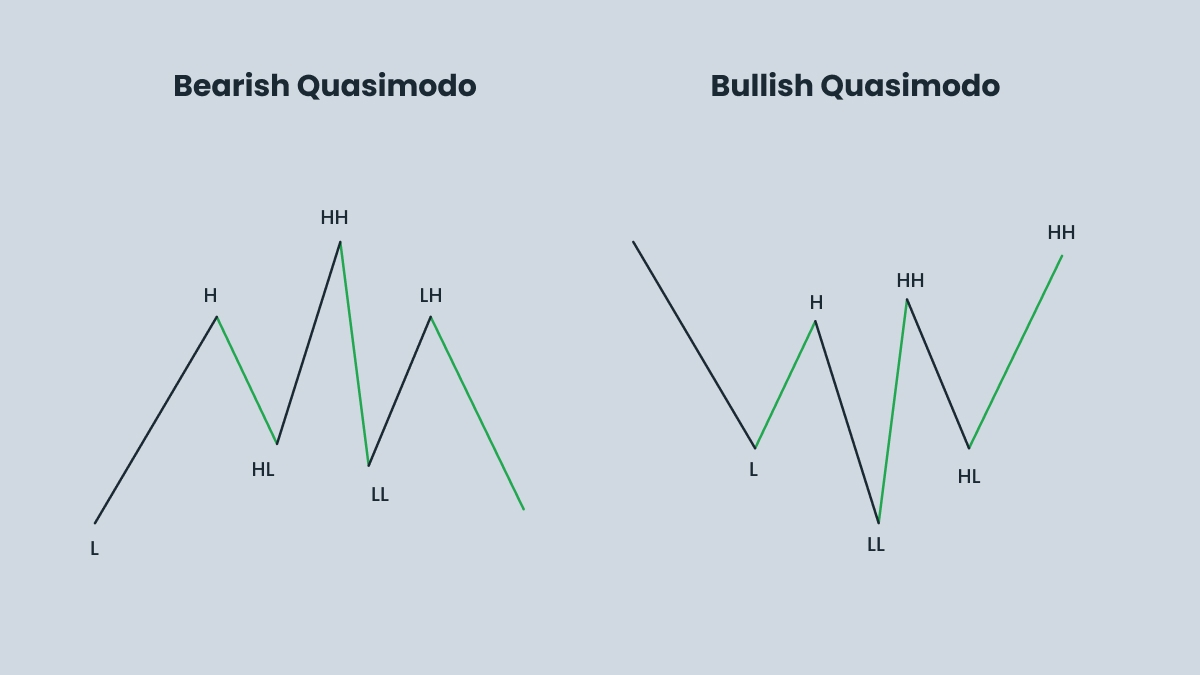
There are two types of Quasimodo pattern: bearish and bullish. In a bearish pattern, the highest peak will be the middle peak, with peaks slightly lower on either side. This pattern signals a potential downtrend.
A reversal from a downtrend to an uptrend can be possible with a bullish Quasimodo pattern. In this pattern, the middle trough is at the minimum, and the extreme peaks will be slightly higher.
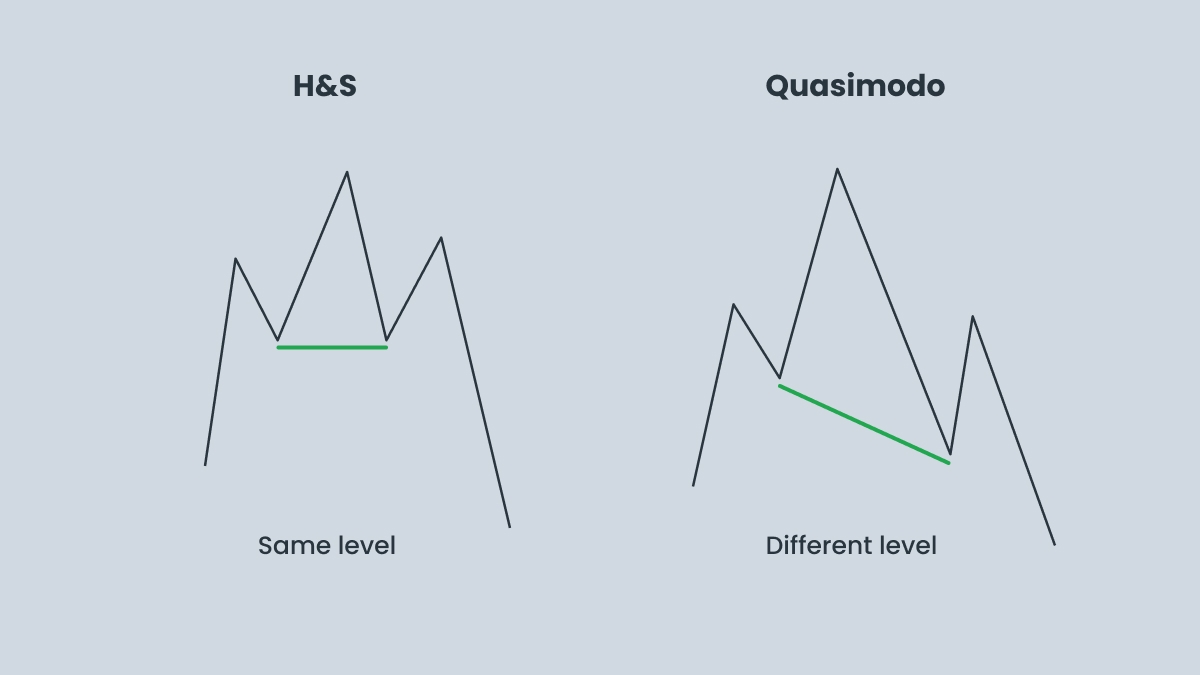
There is another pattern that can be confused with the Quasimodo pattern — the Head and Shoulders. Both patterns are reversal structures with three peaks or troughs and a central head, but they provide different entry and exit points and differ in mechanics.
The Head and Shoulders pattern has three highs and two lows in a bearish scenario, with the second peak being the highest. Three lows and two highs appear in a bullish scenario, with the second low being the lowest. To distinguish this pattern from a QM, draw a ‘neckline’ connecting two lows in a bearish structure and two highs in a bullish one. If the line is straight, then it is a Head and Shoulders. The line will be tilted in the QM pattern.
The Quasimodo pattern is based on the concept of higher highs and lower lows. The reversal occurs sharply and changes the structure of the previous trend. If you draw a neckline, it will be tilted. The third minimum (in a bullish QM) or the third maximum (in a bearish QM) exceeds the previous levels and then reverses.
The classic entry into a trade with the Head and Shoulders pattern occurs when the right shoulder line crosses the ‘neck’. In this case, traders have a chance to get a guaranteed profit, since it is believed that the price level will fall no less than the height of the head.
The Quasimodo pattern allows for an early entry. It is usually made before the neck line during a retest of the last structural level (point A). This gives a better R:R ratio, but requires accuracy. It is assumed that the price can bounce off the second peak, forming a pattern, and continue moving in the direction of the expected reversal.
| Pattern type | Structure | Trade bias |
| Bearish quasimodo pattern | HH – LL – Retest | Sell setup |
| Bullish quasimodo pattern | LL – HH – Retest | Buy setup |
In both bullish and bearish cases, there is a breakout of the internal structure, followed by a return to the base.
1. The bullish Quasimodo pattern appears at the end of a downtrend and signals a potential upside. The market forms lower lows (LL) and lower highs (LH). The new low convinces traders that the downtrend will continue, but the price suddenly breaks the structure and forms a new higher high. The price then returns near the level of the previous low. In this scenario a bullish reversal occurs.
2. The bearish Quasimodo pattern is the opposite of the bullish one. It appears at the end of an uptrend and foretells a market decline. Higher highs and higher lows are formed. Traders who trade the breakouts are trapped by the new highs. The price breaks through the structure, creating a new lower low, then retraces back to the previous high.
Both patterns need confirmation — do not rush into a trade when the price pulls back.
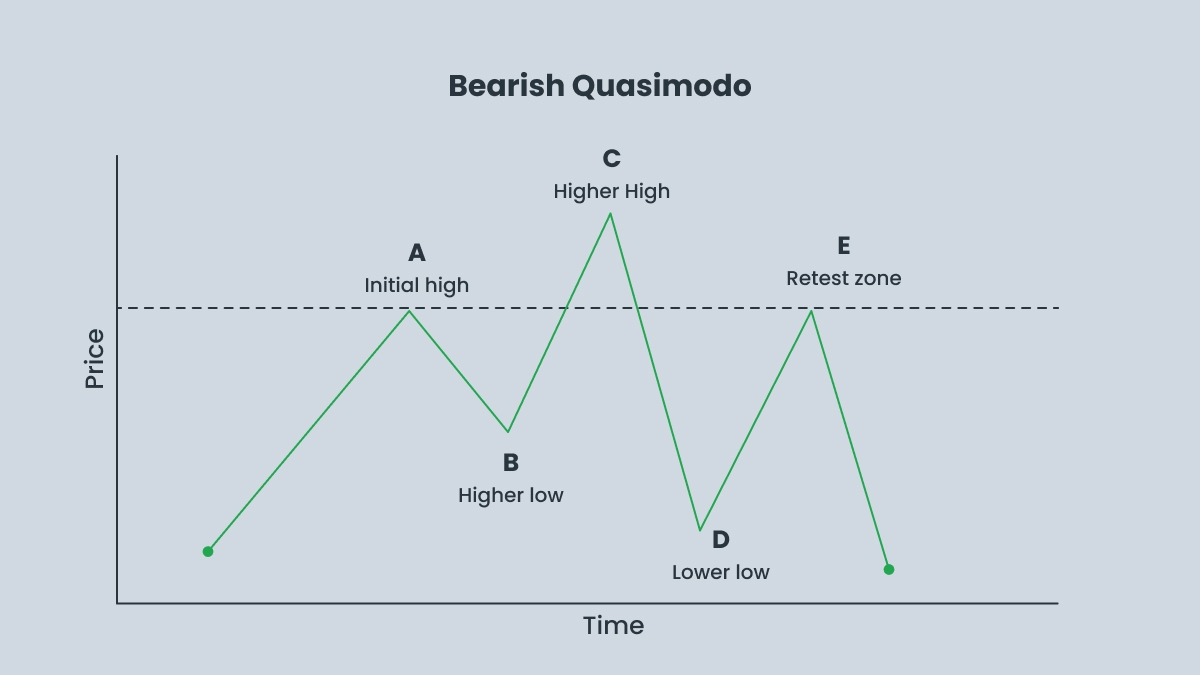
Let’s see how the Quasimodo pattern works in practice in an uptrend.
1. Point A is the first indicator of potential reversal and future resistance. For the bearish model of Quasimodo, it’s the initial high of an uptrend.
2. Point B is a corrective pullback, because the price rolls back and the temporary minimum creates a neck line.
3. Point C demonstrates that the price is moving up, creating a new extreme point compared to Point A. This is the highest maximum for a bearish pattern, which indicates new potential resistance in the future.
4. Point D shows the price making an impulse move in the opposite direction and forming a lower low, breaking the neckline set at point B. This step is an important confirmation of the developing trend.
5. Point E demonstrates that the price comes back to Point A, which acts as resistance, not rising above Point C. This is an ideal point for entry.
.jpg)
Here is an example of how the Quasimodo works in a downtrend.
1. Point A is the starting point of a downtrend, which forms the penultimate minimum and indicates a potential change in trend.
2. Point B is a corrective pullback, during which a temporary maximum is formed and horizontal resistance is established.
3. Point C shows that the price is falling again and a lower minimum is formed. It is in this area that future support is formed and the downward movement ends.
4. Point D is the formation of a higher maximum. This point is called the Quasimodo level and it confirms a bullish reversal.
5. Point E shows that the price is rolling back to the level at point A. This point is optimal for entry.
Traders use different tools to identify the Quasimodo pattern.
First of all, you should pay attention to trendline and fractals, because the Quasimodo pattern forms only in an uptrend or a downtrend. It will help you mark swing highs/lows.
If the RSI (Relative Strength Index) demonstrates hidden divergence, it often means that the market is ready for reversal.
A rectangle is often formed when the price is moving sideways, between a clear support (bottom) and resistance (top). This means the price is stuck in a range. In a Quasimodo pattern, this sideways movement can be part of the pattern where the price makes a failed swing (a higher high or lower low that does not hold) before reversing direction.
1.Make sure there is a clear trend before the Quasimodo structure is formed.
2. Zoom out and note if there are any breaks in the structure. Ignore minor pullbacks.
3. Note the minimum or maximum followed by a pullback.
4. Wait for the price to reach the original zone.
5. Look for confirmation, such as RSI divergence.
Remember that there is no universal indicator for the Quasimodo pattern, use additional tools for analysis, logic and patience. A good combination of the Quasimodo is with trend lines and imbalances.
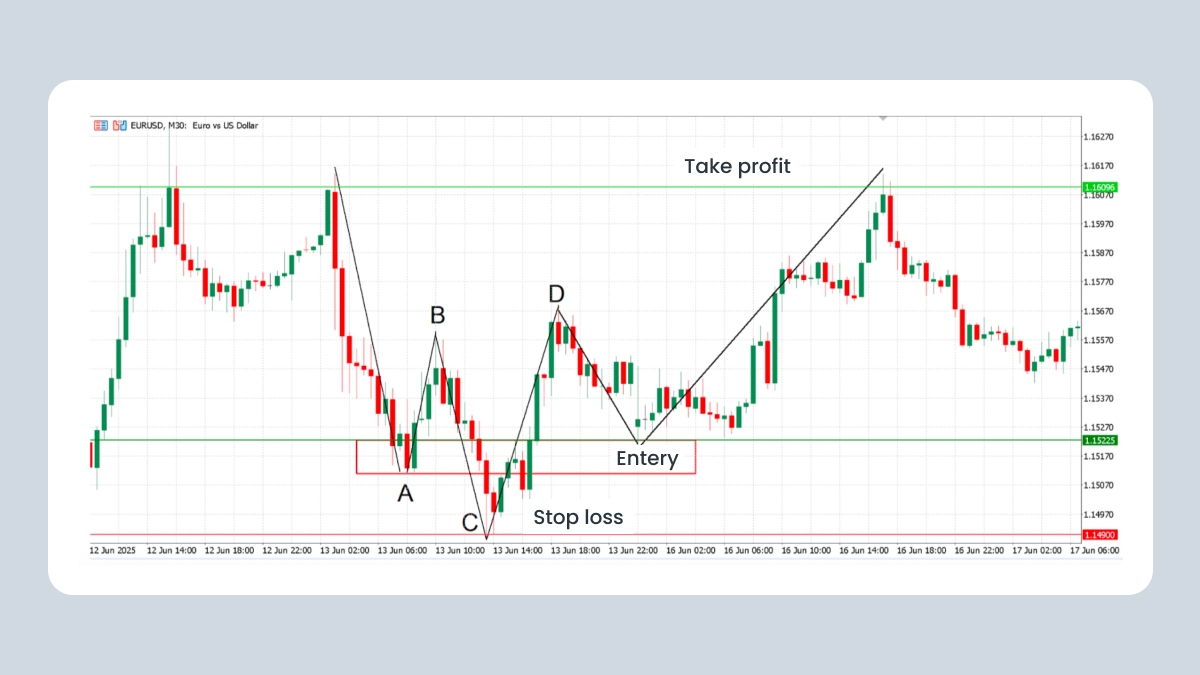
Entry strategy varies depending on the type of QM. Let’s have a look at a strategy for a bullish QM.
1. Identify the Quasimodo pattern in the key swing points A, B, C, and D.
2. Enter long at point A when price retests the demand zone and retraces down from point D.
3. Set a stop-loss slightly below the low of point C to manage risk.
4. Set a take-profit order at the peak between the head and the right shoulder, apply a risk to reward ratio of at least 1:2.
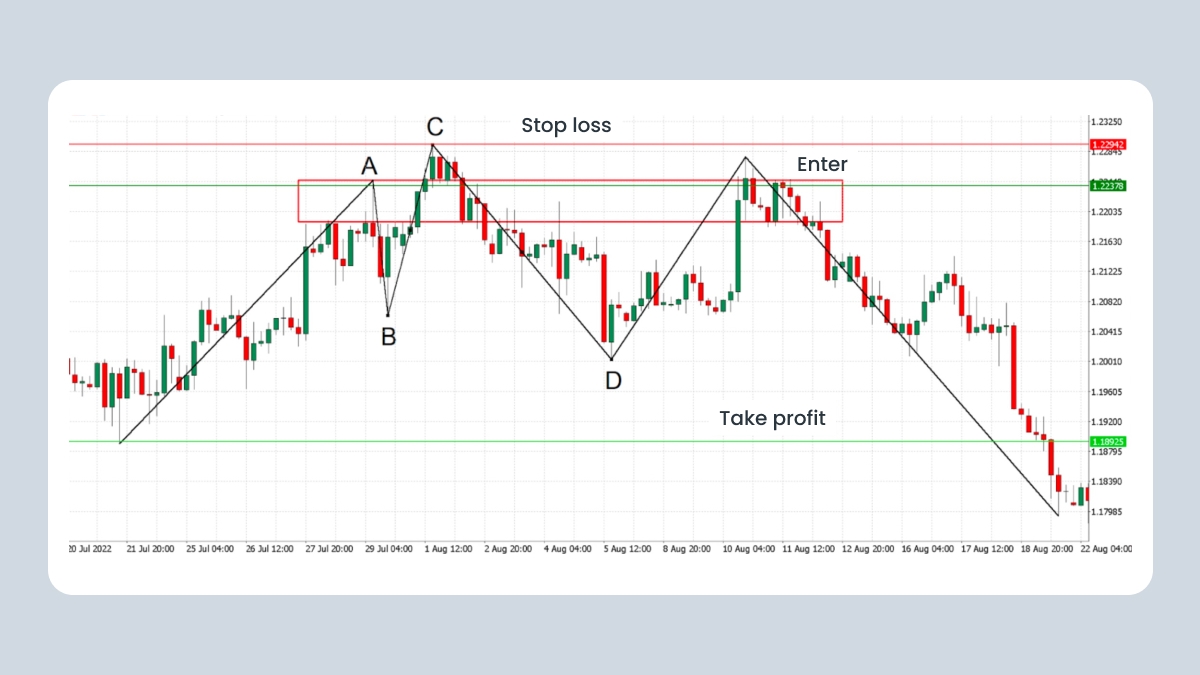
Take these steps for a bearish QM.
1. Mark swing points A, B, C, and D to define the Quasimodo reversal structure. This step is the same as for a bullish QM.
2. Enter short near Point A as price retests its supply zone and pulls back after Point D.
3. Place the stop-loss just above the high of point C to manage downside risk.
4. The take-profit should be at prior resistance zones or align with a risk/reward ratio of 1:2 or better.
Even experienced traders can make mistakes using the Quasimodo pattern. Being aware of the risks is part of trading successfully.
1. Minor fluctuations can be perceived as a QM and mislead. Watch the context to avoid unexpected results.
2. Pattern identification is complicated and involves recognizing the shoulder, neck, and head lines, which can be a challenge for beginner traders.
3. Patience is required, as you need to wait for a pullback to the left shoulder to ensure a correct entry.
4. Additional tools are needed to confirm the pattern, such as RSI or moving averages, so additional analysis is required.
5. Aggressive entries can lead to serious losses. You need to wait for confirmation signals.
Avoid using QM impulsively and without confirmation signals, set a stop-loss and take-profit order.