The Volume Profile indicator: what it is and how to use it in trading
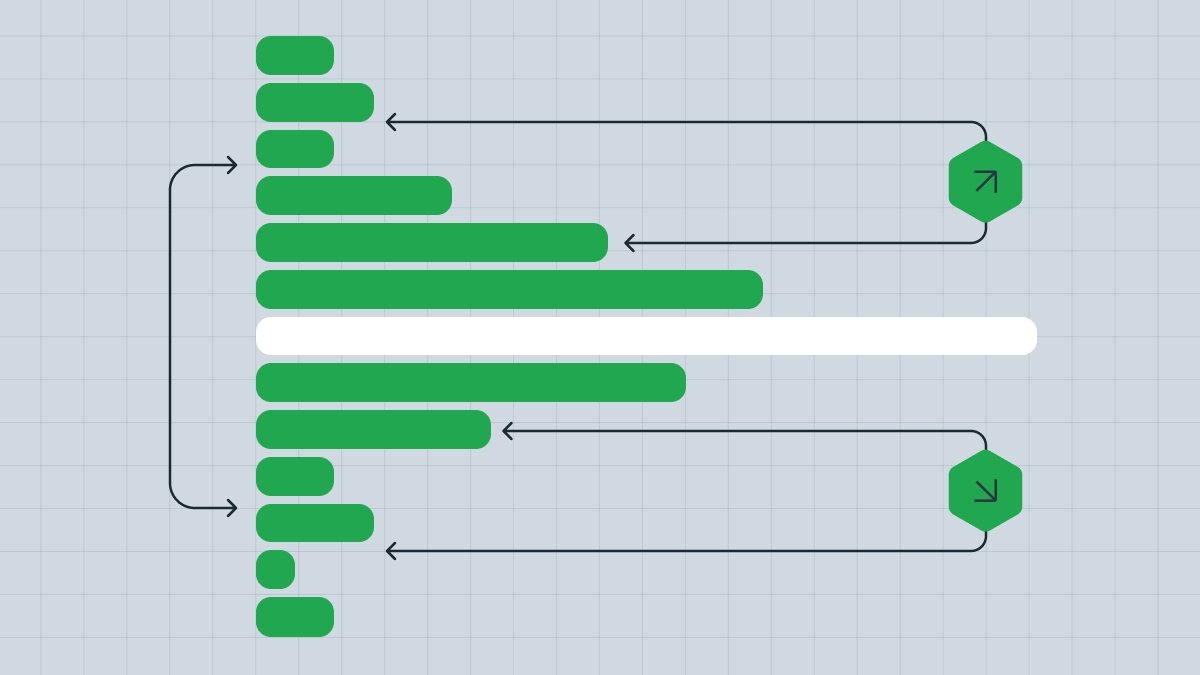
The Volume Profile indicator represents trading volume not for a period of time, but at specific price levels. The Volume Profile is presented on the chart as a horizontal histogram, where each bar reflects the total trading volume at specific price ranges. The longer the bar is, the higher the volume.
While a traditional volume indicator displays data on trading volume for a specific period of time, the Volume Profile shows the price zones where traders have made trades. The Volume Profile shows how trading activity has grown, peaked, and declined within a given period.
How the Volume Profile works
1. Price levels are the horizontal axis showing trading activity within a certain price range.
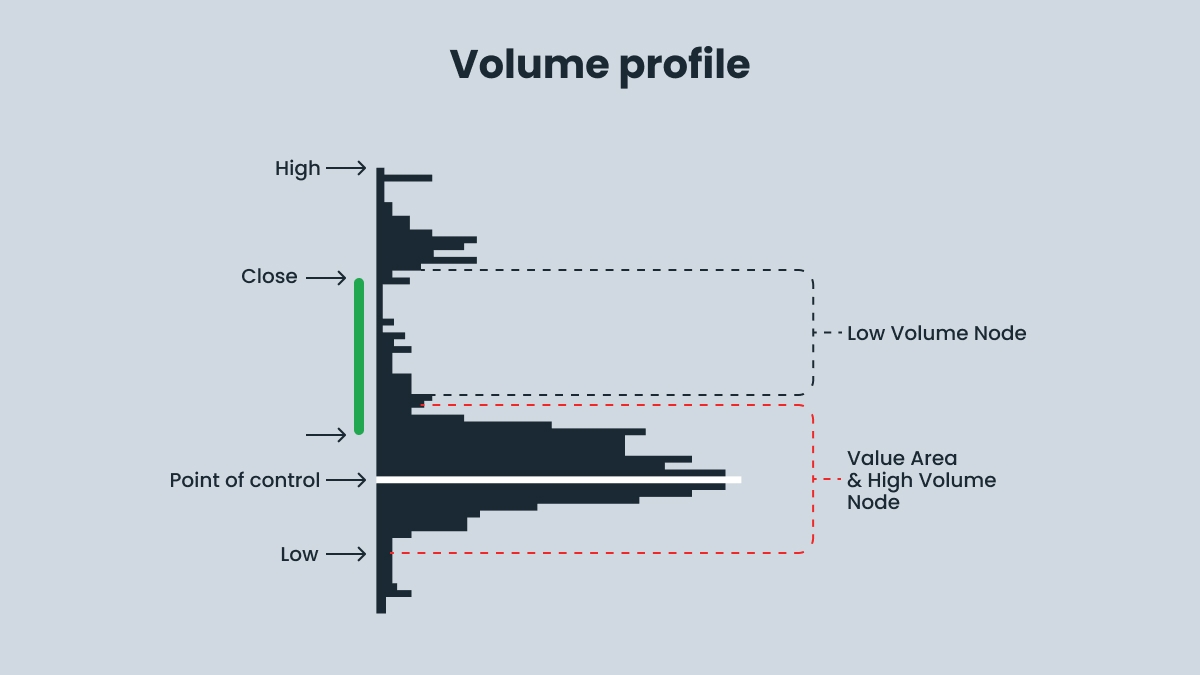
2. Volume nodes show where the largest trades were observed. They can be divided into two types:
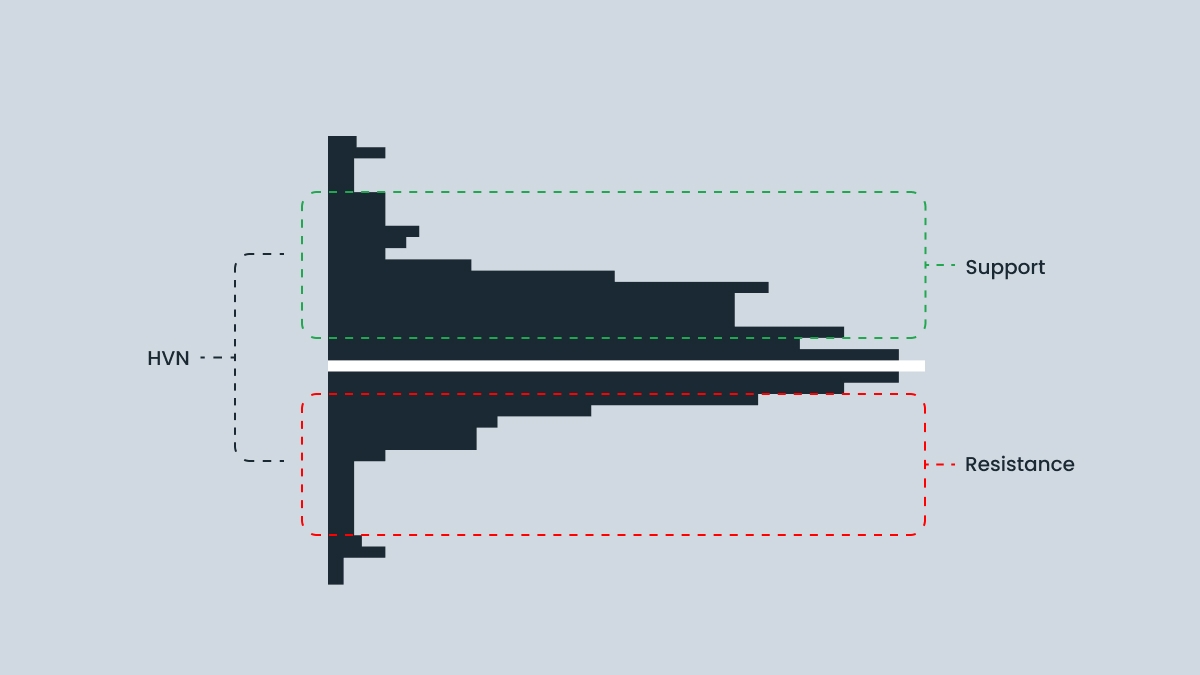
- High volume nodes (HVN) show where significant trading activity occurрed, signaling high interest and likely areas of support or resistance.
- Low volume nodes (LVN) demonstrate minimal trading activity, which leads to rapid price changes due to a lack of interest.
3. Point of control (POC) is the level where the most trades were executed. It is usually shown as a red line.
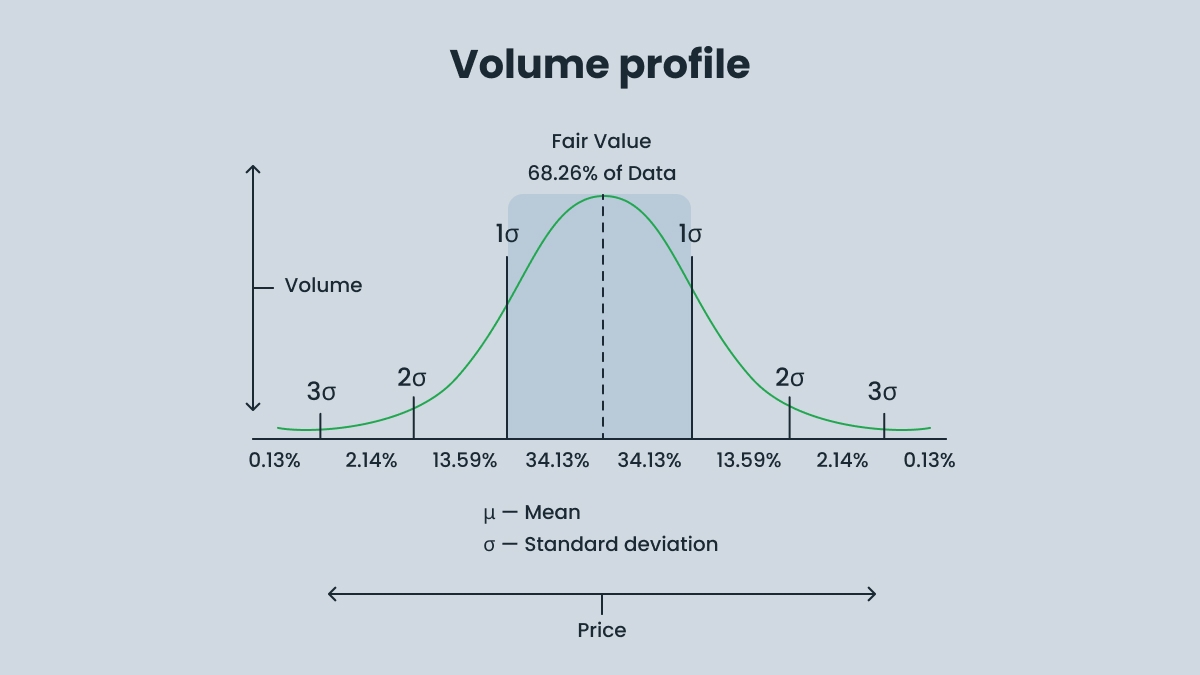
4. Value area (VA) is the range of price levels where 70% of the trades occurred. This zone is important for determining the fair price zone. This is where the balance between supply and demand is represented.
5. Volume weighted average price (VWAP) is the trading volume at each price level, which provides insight into market sentiment compared to a simple average price.
Unlike time charts, the Volume Profile indicator demonstrates where the market has been most active.
Types and platforms
Traders use various plugins and platforms to determine the Volume Profile.
- Custom plugins: FXSSI (FX Social Sentiment Indicators) and MetaTrader Market Products. FXSSI provides various volume-based tools, including Volume Profile, order flow, and market depth analysis. The MetaTrader Market has a plugin called “Volume Profile.” However, the functionality of these plugins is limited.
- TradingView is a more flexible volume profiling platform. It allows for profiling of different types of volumes:
- Fixed Range Profile is useful when traders want to analyze a specific period or segment of the chart. It can highlight areas where volume has accumulated over a user-defined range, which is useful for breakout setups.
- Session Volume Profile resets daily/weekly, making it excellent for day trading or analyzing specific trading sessions. It can show which price levels received the most attention during each session.
- Visible Range Profile automatically adjusts to the visible chart area, which is great for quick analysis across different timeframes without having to manually define the range.
- Other professional platforms (Sierra Chart, NinjaTrader, or Bookmap) offer more granular tick-based profiling, but the core logic is the same as in TradingView.
How to use the Volume Profile in trading
Trading from value to value works in a balanced market with a sideways trend or consolidation. The idea behind this strategy is that if the price reaches a maximum or minimum outside the balance zone, it will likely return to the fair value. In this scenario, the value area high (VAH) acts as resistance, while the value area low (VAL) serves as support. When the price is near the VAH, you might consider selling, anticipating that it will pull back to the POC or the VAL. When the price approaches the value area low, you can buy, expecting the price to return to the POC or value area high.
Breakout from Balance is used when the price breaks out of a value area with volume and moves to a new value area. This situation is observed at the beginning of a strong trend, when the price accelerates in one direction and forms a new profile with another value area and a point of control (POC). A breakout happens when there is strong volume behind it; if the volume is lacking, the move is likely a false one. Keep an eye on whether the price breaks above the high of the value area (for a bullish breakout) or below the low of the value area (for a bearish breakout). Once the breakout is confirmed, you can trade in the direction of the move. For instance, if the price breaks above the value area’s high, consider buying and riding the trend.
Low volume node rejection is a situation that occurs when the price enters a low-volume area where there is little or no trading activity. When the price enters a low-volume area, it typically speeds up and moves through it quickly. This happens because there is less interest in trading at those price levels, which allows the price to move faster. Traders generally expect the price to either bounce off or quickly pass through these low-volume zones, rather than getting stuck or consolidating. If the price approaches a low-volume area, trades can be entered with the expectation that the price will bounce off.
Volume profile trading strategies
There are two main strategies for trading on the Volume Profile:
High-Volume Node Retracements is a strategy that focuses on price pullbacks to high-volume nodes (HVNs). HVNs are areas where the market has previously traded with high volume. These areas often serve as strong support or resistance levels. Traders use HVNs to see if the price will pull back to one during a trend, helping them evaluate the chance of a reversal or a price stall. In a bullish trend with HVNs, traders usually buy, while in a bearish trend, they’ll look to sell. Confirming the reaction with volume or reversal patterns increases the likelihood of success.
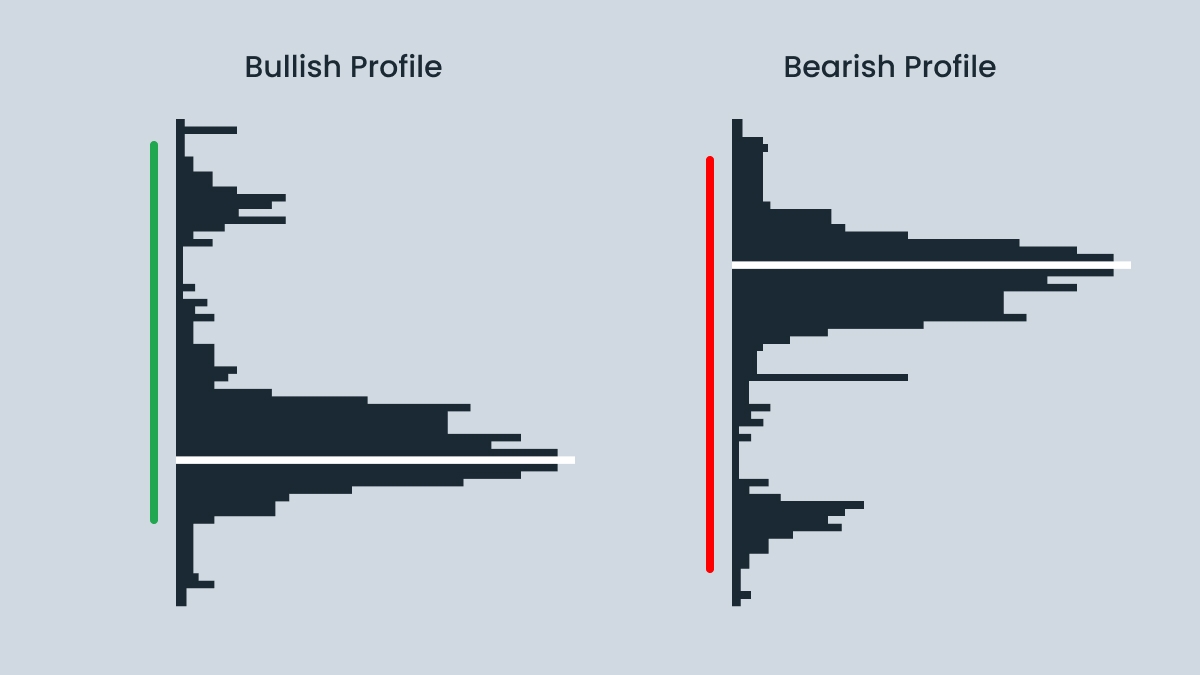
Determining Trend with Distributions is a strategy that helps identify market trends by analyzing how volume is distributed across different price levels. When volume increases at higher price levels, it signals a bullish trend, while higher volume at lower levels points to a bearish trend. With this strategy, you can determine whether the trend is strong. Changes in volume distribution can indicate a potential trend reversal or consolidation phase.
Both strategies can be used together to identify trends and entry levels. High-volume node retracements provide accurate entry points during pullbacks, while distribution analysis helps determine the overall strength of a trend.
Best practices and settings
Here are some pieces of advice on settings you can use for Volume Profile trading.
1. Use a fixed range in strong momentum moves to identify the bottom of the breakout. When choosing a range for a strong move, you can identify the bottom of the breakout, which usually corresponds to a point of price consolidation before the move began. The point of control (POC) or value area (VA) within this range is critical as they represent price levels where the most trading activity occurred. Once the price breaks out of this range, the POC or VA can be used as a support level (if the price is moving up) or resistance (if the price is moving down). This helps to determine where the price may rebound to or continue in the direction of the breakout.
2. Link the Volume Profile to news candles or bounce wicks to help identify important levels created by these events. These levels usually represent areas of high volatility where significant volume is being traded. Watch to see if the market follows these areas or rejects them. In the future, you will be able to better analyze the market when similar moves occur.
3. Use additional tools for better confirmation:
Trend lines will help you understand the context and inform you whether the trend is bullish or bearish.
Confirmation of candlestick patterns at VA highs/lows: follow candlestick patterns, because they can provide confirmation for potential reversals or trend continuation.
RSI or VWAP to analyze market strength/weakness: Use the RSI (Relative Strength Index) or VWAP (Volume Weighted Average Price) to gauge the strength or weakness of the market. For example, an RSI showing overbought or oversold conditions near key Volume Profile levels (VAH or VAL) may indicate high probability of a reversal. VWAP can show whether the price is above or below the day’s average price.
Short timeframes often generate false signals and are prone to market noise. It’s better to use higher timeframes (H1-H4) to focus on the bigger trends.
Many new traders misunderstand the profile by treating POC as a magnet in every condition. But it only acts like one in balanced or consolidating environments.