.jpg)
Even for an experienced trader, it’s not always easy to predict which way the market is moving. How do you choose the right time for your trades, and why is it important to consider the bursts of trader activity?
Oct 28, 2025
Basics
Even for an experienced trader, it’s not always easy to predict which way the market is moving. How do you choose the right time for your trades, and why is it important to consider the bursts of trader activity?
For successful trading, you need to choose the most volatile time with the most activity. This time is called the “power hour.” In this article, we will examine what power hour stocks are, how to invest in them, and how to use them to make the most profit.
The highest activity of traders occurs at the beginning and end of the trading day. The stock market power hour is not necessarily a clearly defined time limited to one hour. But if we had to set a timeframe, it would look like this:
Morning: 09:30 – 10:30 ET (14:30 – 15:30 UTC)
Note: The New York market runs on ET (Eastern Time), which shifts between EST (UTC-5, winter) and EDT (UTC-4, summer). Always double-check which one it is when you are outside the US.
On early-closure days (e.g. before certain US holidays), the official session ends at 13:00 ET. In that case, the power hour is typically from 12:00 – 13:00 ET.
To understand the power hour, you must keep in mind that the higher the trader activity, the higher the volatility. That’s where you will find your chance to make a profit.
US stocks trade beyond the regular 09:30 – 16:00 ET session:
Pre-market: 04:00 – 09:30 ET
After-hours: 16:00 – 20:00 ET
Key differences vs. regular hours:
Liquidity is thin. There are fewer participants, which means wider spreads and less predictable order fills.
Limit orders only. Most brokers don’t allow market orders in extended sessions.
Volatility can spike. Earnings reports and news often drop outside regular hours, which can cause sharp, illiquid moves.
Extended trading is better suited for experienced traders. Beginners should keep in mind that prices can gap at the next day’s open, making overnight risk higher.
– Market open and close flows
– News and catalysts (earnings, headlines)
– Pre/post-weekend adjustments
– Options expiration Fridays (OpEx) that cause volume spikes
The US stock market opens at 09:30 ET. This is also when the New York Stock Exchange, the largest financial market, opens. Hundreds of multinational corporate giants follow its lead. After a while, another powerful trading hub, the Chicago Mercantile Exchange, enters trading. When market giants come into play, traders step up, increasing volatility.
Many people prefer to trade in the morning. That way, they finish their business faster and have the whole day at their disposal.
The afternoon activity is due to the fact that all major financial companies, including the stock exchange, are closing for the day. At this time, traders seek to complete transactions and close positions. This creates a surge of activity and volatility in the last hour, between 15:00 and 16:00 EST.
In addition, traders are very active before and right after the weekend, as well as after the release of news about major companies. Don’t forget to check your feed regularly!
Those who are interested in trading outside of regular hours can try after-hours trading.
Before you trade power hour, you need a watchlist. The best stocks to trade in the last hour share two traits: news catalysts and high volume. Here’s how to spot them:
1. Scanners. Use a market scanner that shows top intraday gainers and losers, unusual volume, and stocks breaking key levels. These lists often reveal the tickers attracting the most attention before the close.
2. News feeds. Earnings announcements, FDA approvals, analyst upgrades, and M&A headlines often trigger late-day surges. A real-time news feed (or even Twitter or stock news apps) can help you catch news related to specific tickers.
3. Volume leaders. Check the daily volume leaderboard. Stocks trading 2–3x their average daily volume are prime candidates for active power hour moves.
4. Earnings calendar. Companies reporting after the close often see unusual activity in the final hour as traders position ahead of results.
5. NYSE imbalance data. Around 15:50 ET, the NYSE publishes order imbalances (large unmatched buy and sell orders). Professionals keep a close eye on these because they can drive powerful last-minute swings.
Having your list ready before 15:00 ET is key.
You should already know which stocks are in play by the time the final hour begins.
Not every power hour is the same. Certain days and events tend to make the last hour busier than others:
Fridays: Often the most volatile power hour. Traders close positions before the weekend, and expiring options contracts can create sharp moves.
Mondays: The market reopens after two days of news. Monday power hour can be busy due to institutions adjusting their positions after weekend headlines.
Monthly and quarterly options expiration days: Also known as “OpEx,” these days have high volume in the final hour of the session as traders roll or close expiring contracts. Imbalances can drive sudden swings.
Earnings days. Stocks reporting after the close often experience heavy power hour activity as traders position ahead of results.
Knowing the calendar helps you understand the market better. A quiet Tuesday close isn’t the same as a Friday options expiration day. Adapt your expectations and risk sizing accordingly.
Professional traders like stock market power hours because they are periods of high liquidity and increased trading volume on the market.
One of the key components of successful trading is understanding the specifics of trading in different trading sessions.
That will allow you to use your time and resources effectively and efficiently.
You can use different strategies to trade during power hours. There are a lot of options, and here are the best to apply during the stock market power hour:
Scalping means making very short trades (seconds or minutes long). This is even riskier during the power hour because spreads widen and volatility spikes. Use tight stops, partial exits, and limit orders to control slippage.
This strategy for experienced traders will play into their hands during the stock power hour. Here they have the opportunity to speed up trading and make more profits.
Day traders focus on the first and last hours when liquidity peaks. It’s important to manage risk by setting a maximum loss, limiting the number of trades, and being aware of halts in volatile stocks. Day traders close their positions on the same day they opened them. They may also make several transactions with the same asset during the day, or for several different assets.
Swing traders use the power hour to make entries and exits near the close, where liquidity is highest and the closing price offers confirmation. Avoid chasing late spikes, instead planning entries over multiple days.
To use the swing movement, you need to have the analytical skills to act flexibly and apply different tactics depending on the circumstances. Learning the strategy takes time and can seem complicated, but the time spent learning the strategy pays off many times over.
Generic advice isn’t enough. Power hour rewards traders who follow clear setups with defined entry, exit, and risk management rules. Here are four of the most common playbooks:
Watch the price range the stock has remained in during the day. If it pushes above or below that “box” with strong volume during power hour, trade in the direction of the breakout.
Example: a stock stayed between $20.00–$20.50 all day. At 15:10 it breaks above $20.50 on heavy volume. This is a buy signal.
If a stock has been trending hard all day (up or down), the power hour can bring a reversal. Look for a hammer candle, long wick, or sudden push against the trend, with volume confirmation.
Example: a stock drops from $50 to $45 during the day, then a hammer forms at 15:10 and the price bounces to $46. This is a signal to go long.
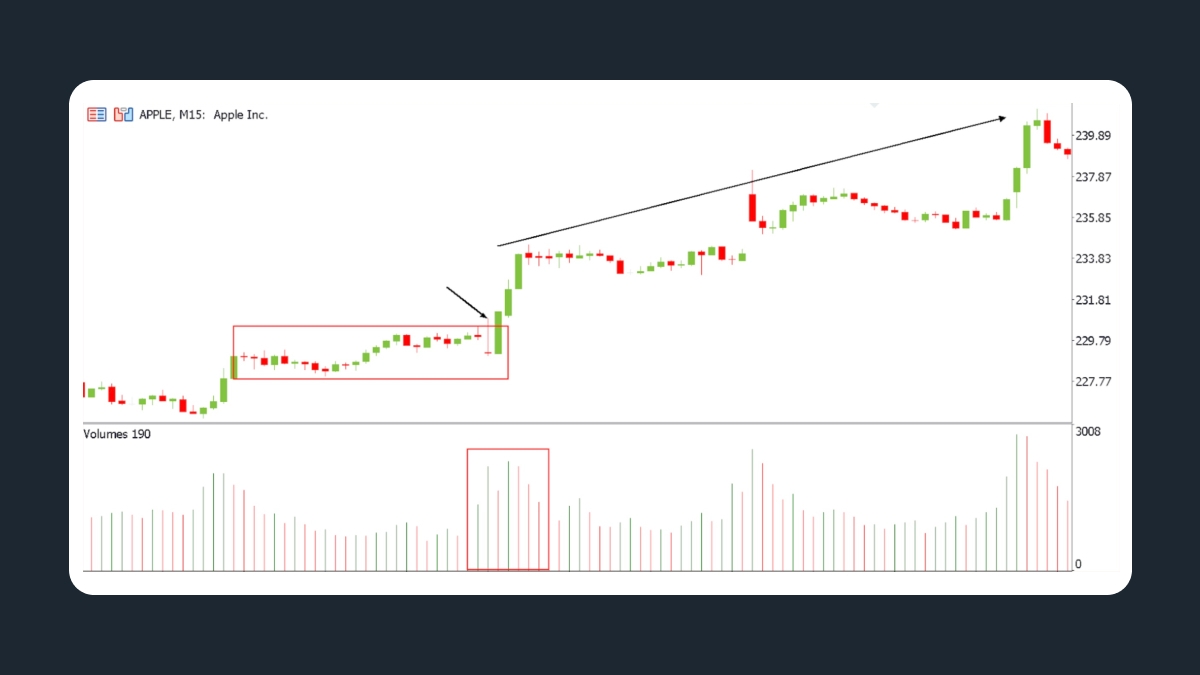
On this 15-minute chart, Apple formed an opening range around $228.50–$229.50 (see red rectangle). Volume was high during this consolidation, showing strong institutional participation.
At around 10:00 ET, the stock broke above the range high on a surge in volume (see black arrow and volume box). That breakout confirmed that buyers were stepping in. A trader could then enter long at $229.60, with a stop just under the range low at $228.50, keeping risk well contained.
From there, Apple trended higher through the session, reaching nearly $239.90 by the close (see upward arrow). Scaling partial profits along the way while trailing the stop under higher lows would have locked in gains with minimal stress.
Takeaway: Combining the opening range with volume confirmation is a powerful way to catch directional moves that often accelerate during the power hour.
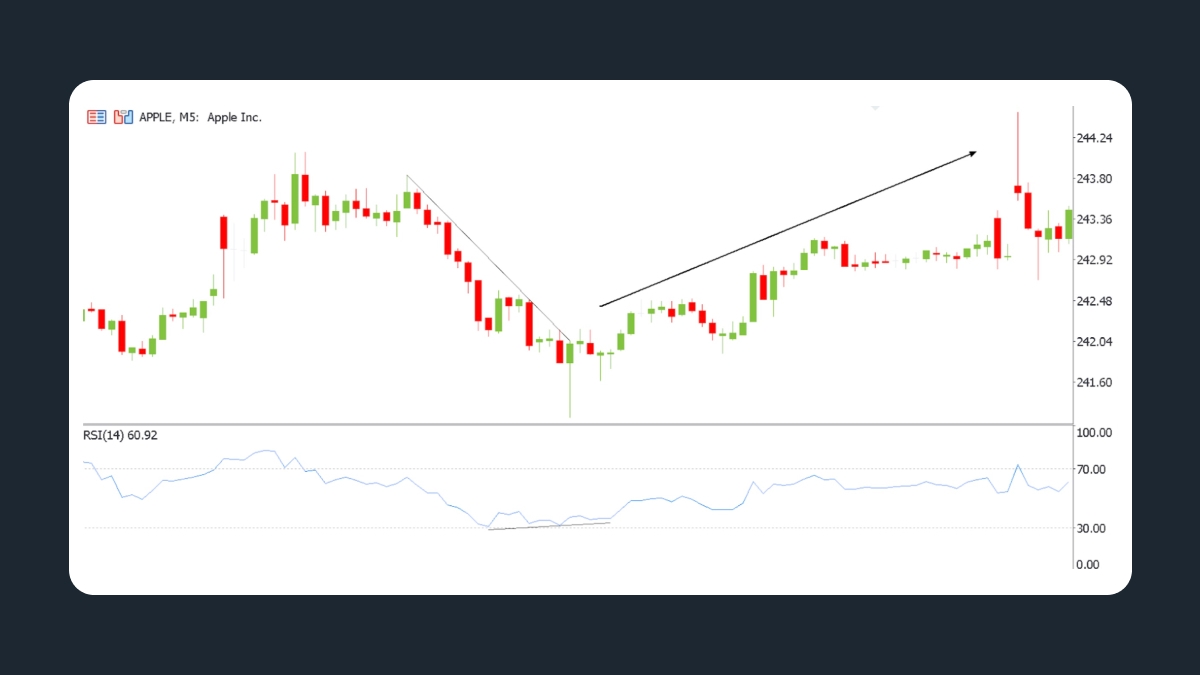
On Apple’s 5-minute chart, we see a sharp drop from $243.80 to $241.60 (see downward black line). However, the RSI indicator below shows the opposite: instead of making a new low, it forms a higher low (see black line on RSI). This is called a bullish divergence.
Around 15:00 ET, a candle with a long lower wick formed — a reversal signal confirming that sellers were losing steam. A long entry was possible near $241.80, with a stop just below the intraday low.
From there, the price steadily recovered and the session closed near $243.50, giving the trader a 1.5R to 2R profit opportunity with proper position management.
Takeaway: An RSI/price divergence during the power hour can be a powerful reversal signal. The key is to wait for confirmation from price action and not to enter blindly.
To trade the power hour effectively, you need more than just patterns — you need the right tools to read what’s happening in real time. Here are a few that will come in handy
VWAP (volume-weighted average price)
This shows the “fair” average price of the day. If the current price is above the VWAP, buyers are in control; if it’s below it, sellers are. During power hour, many funds use the VWAP as a benchmark, so bounces or breaks around it are high-probability signals.
Level 2 quotes (order book)
This shows pending buy and sell orders at each price. Watch for large bids or offers being added and removed in the final hour — this can signal big moves or fakeouts.
Time & sales (the tape)
This tool shows every trade. A sudden rush of green (buys) or red (sells), especially with large orders, often comes before a breakout. Keeping an eye on the tape during power hour helps confirm whether the volume behind a move is real or just noise.
Liquidity and spreads
Spreads can widen in periods of volatility. Low liquidity means higher slippage risk, so adjust your position size accordingly and stick with liquid tickers.
Make the most of power hour by reading volume and flow as much as charts. Combine these tools — using the VWAP for structure, level 2 and tape for timing, and spreads/liquidity to size your positions correctly.
Power hour can deliver big opportunities, but it also carries unique risks. Traders should approach it with extra caution:
Volatility and slippage
Prices can move so fast that orders end up filling at a worse price than expected. To reduce this risk, use limit orders rather than market orders whenever possible.
Position sizing
Trade with a smaller position size than you would during calmer hours. A single candle during power hour can wipe out an oversized position. Cutting size protects your capital while you get the hang of it.
Stop-losses
Always set a stop-loss to protect yourself before entering a trade. Moving or removing stops during a volatile session is one of the fastest ways to lose money.
Daily limits
Know how much you’re willing to lose beforehand, and stick to it. Power hour can move so fast that it can be easy to lose your cool or resort to revenge trading. Pre-defined limits help you walk away before the damage gets too big.
Remember: trading power hour is optional. It’s better to sit it out than to go in without the right preparation or context.
How you place your order is just as important as where you enter. In the last hour, liquidity is high and moves are fast, so order type makes a big difference:
Market vs. limit orders
Market orders can suffer extreme slippage in volatile power hour swings. A limit order caps your price, ensuring you don’t chase a runaway move.
Bracket orders
If your broker allows them, use brackets (entry + stop + profit target). This locks in your plan from the start and helps prevent emotional mistakes while under pressure.
MOC and LOC orders
Market-on-close (MOC) and limit-on-close (LOC) orders execute during the official NYSE/Nasdaq closing auction (16:00 ET).
MOC guarantees a fill at the closing price.
LOC allows you to set a maximum or minimum price while still participating in the auction.
Funds use these types of orders to align with benchmarks and rebalance into the close.
When to avoid market orders
In the last couple of minutes (15:58–16:00 ET), spreads can widen. If you aren’t using MOC or LOC orders, stick to limit orders. Otherwise, the order could fill at a worse price than the one you expected.
The closing auction is where institutional volume is concentrated. Understanding how it works lets you exit safely or surf the big waves.
Power hour is mainly a playground for short-term traders, but it also matters for investors who think in terms of months or years. The last minutes of the trading day often have the highest liquidity and most accurate reflection of institutional flows. That’s why many funds and portfolio managers prefer to place orders into the close.
Use market-on-close (MOC) or limit-on-close (LOC) orders. These order types ensure execution at or near the official closing price, which is the benchmark used for index funds and performance reporting.
Benefit from higher liquidity. Spreads are usually tighter in the final auction, lowering transaction costs for large orders.
Avoid intraday noise. By trading near the close, long-term investors sidestep irrelevant mid-session volatility.
Rebalancing and ETFs. Many funds adjust their positions at the close to align with index weights, so prices at this time often reflect the best “consensus” valuation of the day.
For investors, the point isn’t to chase intraday swings, but to use the closing session to open or close positions efficiently.
This three-step plan can make your power hour trading more manageable:
1. Pre-market preparation
Be on top of the latest news, earnings calendar, and overnight headlines.
Draft a watchlist of 3 to 5 stocks with high volume, catalysts, or imbalance activity.
Mark key levels: pre-market highs and lows, VWAP, support and resistance zones.
2. Execution during power hour
Enter only when your setup is triggered (breakout, VWAP bounce, reversal).
Use limit orders to control slippage and trade smaller amounts than usual.
Place your stop as soon as you enter, and trail it if the trade moves in your favor.
Take partial profits instead of holding out for the absolute top or bottom.
3. Post-market review
Record each trade: entry, exit, stop, outcome, and reasoning.
Note whether the setup worked or failed.
Identify one thing to improve for the next session, such as tighter stops or better timing).
Consistency matters more than chasing every move. Having a plan and evaluating how each session went will allow you to hone your skills and build confidence when trading power hour.
Is power hour trading suitable for beginners?It can be, but volatility is higher than in other parts of the day. Beginners should start small, focus on one or two setups, and always use stop-losses.
Can small accounts trade power hour effectively?Yes. Liquidity during power hour is high, which helps smaller traders enter and exit quickly. Overtrading can empty out small accounts fast, so focus on quality, not quantity.
Does the PDT (Pattern Day Trader) rule apply?Yes. In U.S. markets, accounts under $25 000 can only make three day trades in a rolling five-day period. Power hour trades count toward that limit.
Can you short stocks during power hour?Yes, if your broker has shares available to borrow. But availability can dry up late in the day, and if the stock jumps, squeezes will be more dramatic. Always size conservatively when shorting.
VWAP (volume-weighted average price)The average price of a stock weighted by volume. Traders use it to gauge fair value and spot pullbacks or intraday support and resistance levels.
ORB (opening range breakout)A trading setup where entries are based on the pricebreaking above or below the high/low of its opening range (the first 15–30 minutes of the session).
MOC/LOC (market-on-close/limit-on-close orders)Special order types that execute at the official market close. MOC guarantees execution at the closing price, while LOC only fills if the price is at or better than your set limit.
LiquidityThe ease of buying or selling a stock without significantly moving its price. High liquidity means tighter spreads and faster execution. Power hour typically has peak liquidity.
SlippageThe difference between the expected price of a trade and the actual price at which it’s executed. Common in fast-moving markets like power hour.