Open account
Open accountLog In
Open account

Aug 28, 2025

Strategy

How to Read Heikin Ashi Candles and Apply the Trading Strategy

In this article

Heikin Ashi Candles

Candlestick charts show you the price of an asset over specific periods of time. They form patterns that can signal where the market may be going next, and traders use them in technical analysis (TA) to find good entry points for their trades. These charts can be a little confusing because there’s so much going on. It can be hard to tell if the market is making real moves or if what you’re seeing is just noise. That’s because traditional candlesticks show everything: the tiniest price fluctuations, spikes, and gaps, by the second.

Heikin Ashi candles were designed to fix that. Instead of showing “raw” price action, with every single open, close, high, and low prices, they average it all out. This makes a big difference because they make the market feel a little less chaotic and a lot more readable. Trends become easier to see, direction becomes clearer, and all that noise from little price fluctuations is muted. This article focuses on Heikin Ashi candles, what they are, how they work, and how you can use them in your trading strategy.

What are Heikin Ashi candles?

“Heikin Ashi” is Japanese for “average bar.” Instead of showing raw price action like the open, high, low, and close prices of an asset for each period, Heikin Ashi candles recalculate them from one candle to the next to average them out. Since they show the averages, they don’t show actual market prices the way traditional charts do.

Each new average candle is calculated using the one before it, so the Heikin Ashi formula creates a kind of connected chain. The resulting chart flows more smoothly from candle to candle. This is because it filters out small short-term price fluctuations. That helps traders see the broader trend.

Here’s how Heikin Ashi candles are calculated:

What are Heikin Ashi candles?

Heikin Ashi vs traditional candlestick charts

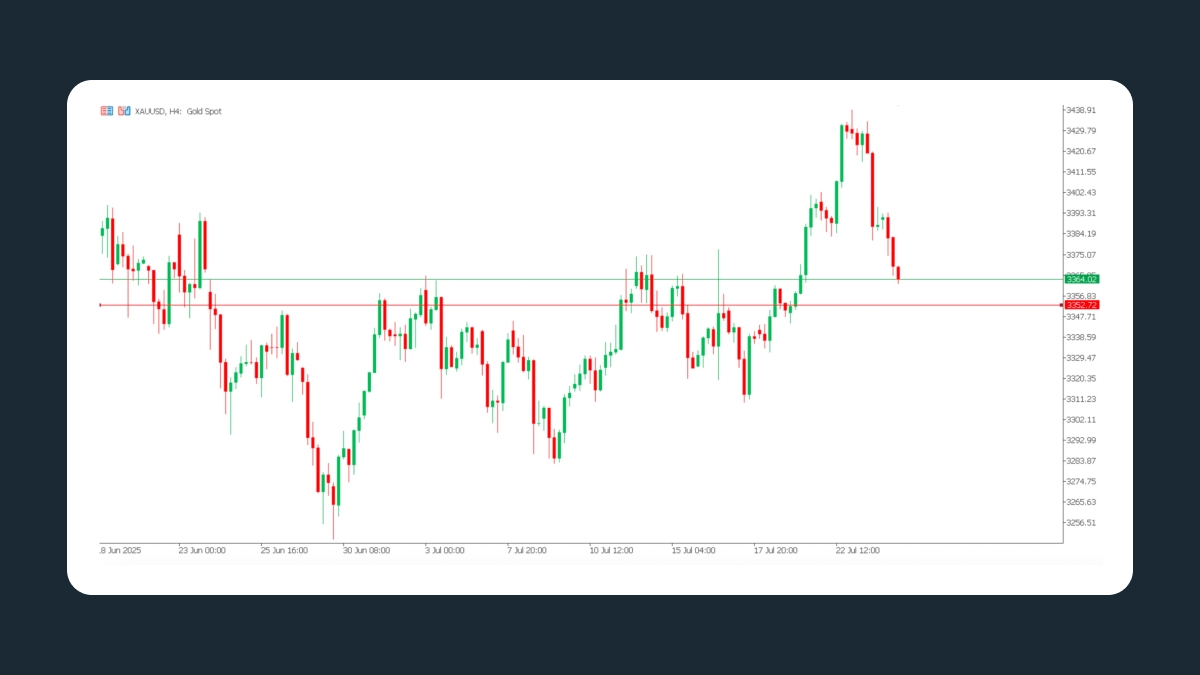
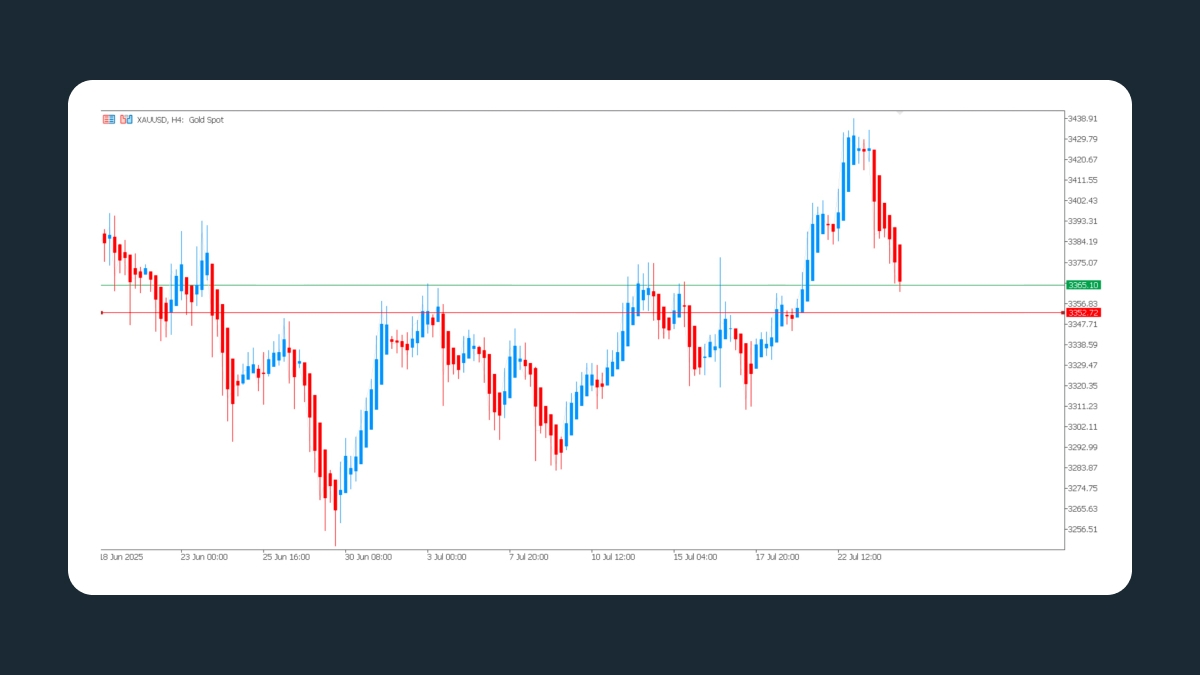
Heikin Ashi and traditional candlestick charts are two different ways of displaying the same asset’s price data. When you compare them, you can clearly see that they show the same market but with different levels of detail and smoothness. The traditional chart is filled with big price moves and volatile changes from red to green candles, while the Heikin Ashi resembles more of a smooth river.

Traditional chart:

Heikin Ashi vs traditional candlestick charts

Heikin Ashi chart:

Heikin Ashi vs traditional candlestick charts

Traditional charts are reactive and twitchy because they display all the details and exact prices. This can be useful if you need real-time data and precision, such as for scalping or finding quick entry and exit points for trades, but not as easy for spotting trends.

If you’re looking for trends and a better sense of the general direction, Heikin Ashi candles will give you a bigger picture because they smooth out the noise and all the tiny pullbacks that can give you fake signals. By using averages, you’re giving up precision and detail for a clearer general view of the trend.

To sum it up:

 Traditional candlesHeikin Ashi candles
Price dataActual price dataAveraged data
NoiseHighFiltered out
GapsVisibleHidden
Trend clarityModerateHigh
Entry signalsFast but potentially unreliableDelayed but clearer

How to read Heikin Ashi candles

Heikin Ashi candles don’t form the typical patterns found in traditional candlestick charts. You won’t see the familiar Inside Bars, Tweezer Tops, or Morning Stars because the averaging or price data distorts the relationship between individual candles. Reading Heikin Ashi candles is more about flow and rhythm, because they form visual sequences that can signal whether a trend is growing strong or weakening.

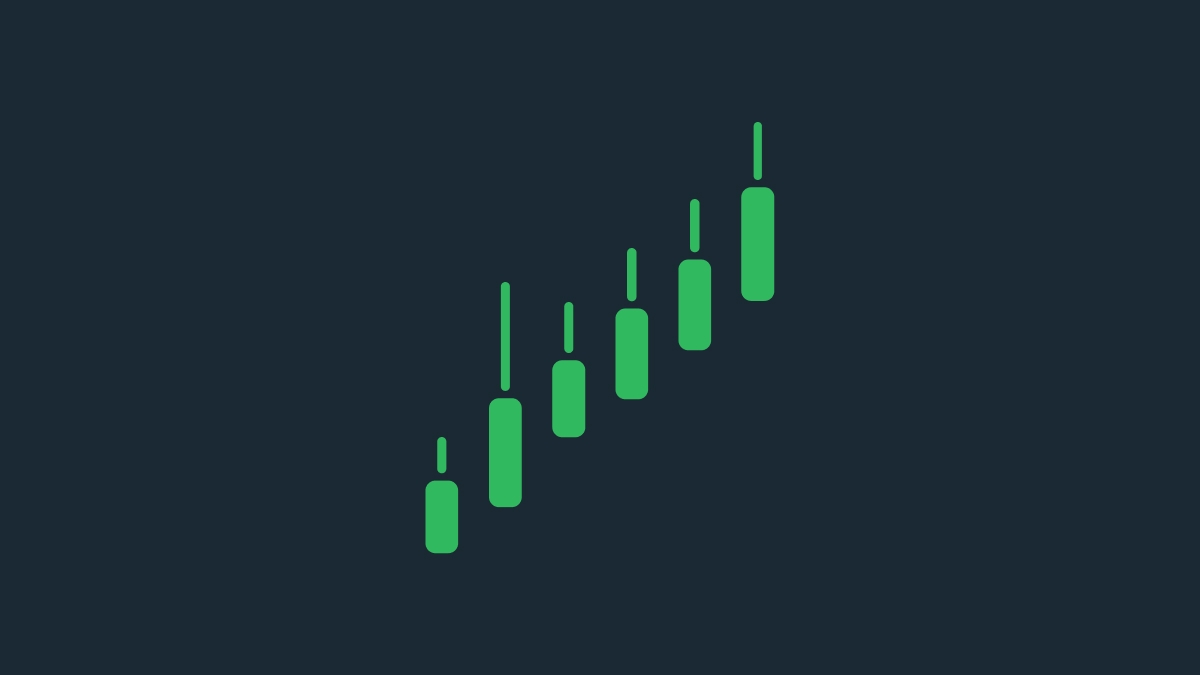
Bullish sequence

Bullish sequence

In an uptrend, you’ll see multiple green candles in a row, often with no lower wicks. Wicks, or shadows, are the thin lines on top of the body of the candles that show how high the price rose during that period. This sequence shows us that buyers are dominating, and that any dips are getting bought up fast. The absence of lower shadows signals strength and confidence.

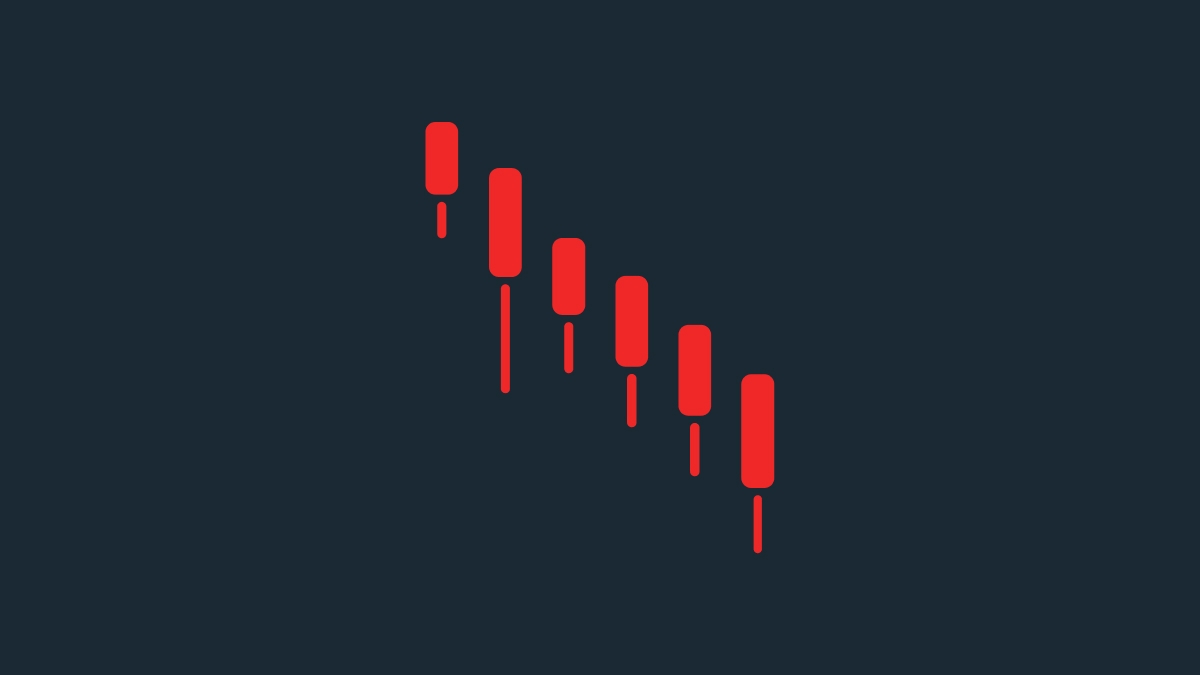
Bearish sequence

Bearish sequence

A series of red candles like the one above, usually with only lower wicks, shows us that sellers are in control. You can see the clear bearish trend as prices keep pushing lower.

Indecision or Doji candles

Indecision or Doji candles

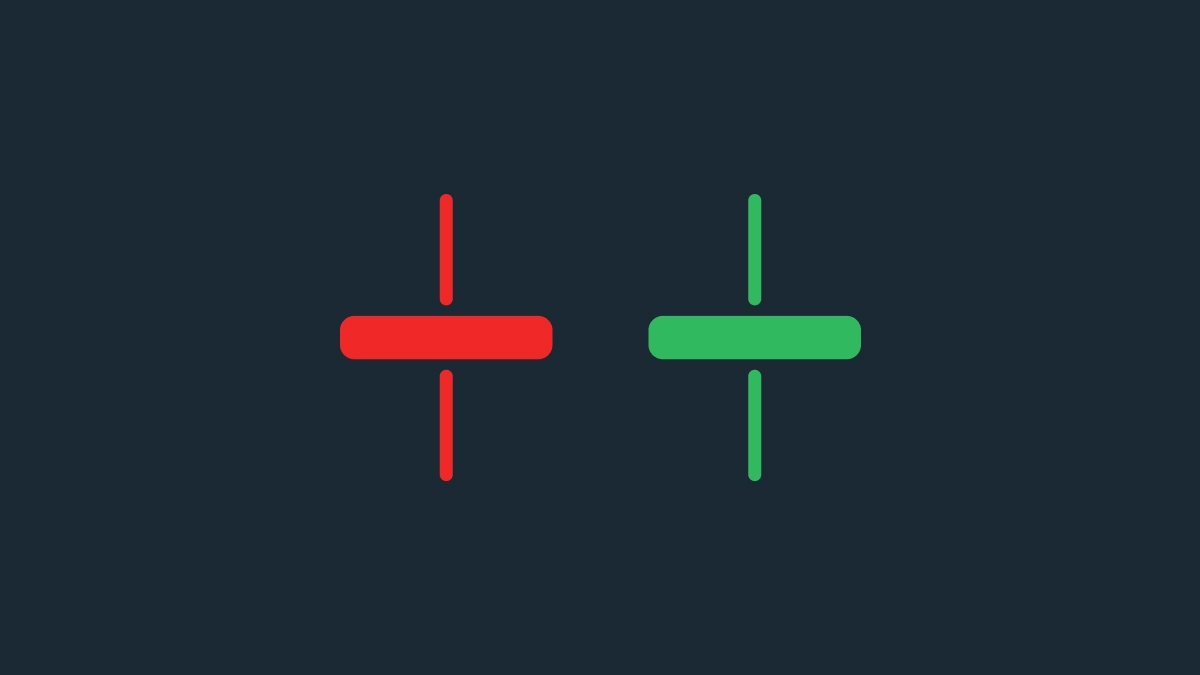
Candles that look like plus signs, with small bodies and wicks on the top and bottom, are called Doji candles. They look like this because the open and close prices are very close. These candles signal that the market is unsure and pausing. They are the first clue that a trend might be losing steam.

Example

After four strong green Heikin Ashi candles with no lower wicks, a small Doji appears with wicks on both sides. This signals a pause or hesitation in the bullish trend. The next candle flips red with an upper wick. The Doji by itself isn’t enough to make the case for a reversal, but the red candle and its upper wick show that the price closed lower than where it had reached, suggesting that bears are now gaining control.

The Heikin Ashi trading strategy

Just like a traditional candlestick chart, the Heikin Ashi is easy to read and understand. It’s straightforward, so you don’t need to make any complicated assessments. This type of chart is built for swing trading and works best with longer timeframes like the 4-hour or daily charts, because these will give you the cleanest signals. Below is a simple strategy for trading with Heikin Ashi candles.

Wait for a trend

To start, spot the trend. At least three candles of the same color are a good place to start. This will tell you that momentum is going in a clear direction. If you see a mix of colors and wicks or a lot of back-and-forth movement, your trend sequence hasn’t formed yet.

Wait for a Doji or pullback

Trends sometimes take pauses during their momentum. If you see a Doji candle in the middle of a trend, wait for the next candle. If the next one continues in the same direction, that’s your confirmation that the trend is continuing.

Set a realistic stop-loss

Switch to a regular candlestick chart to set your stop-loss at the most recent swing high or low for your stop. You shouldn’t base it on the highs or lows of Heikin Ashi candles because they are averages and not the real prices.

Exit when you see weakness

Now that you’ve entered the trade and managed risk with a stop-loss, it’s time to find an exit point. This can be after you see the first sign of reversal, such as a different wick, a color change, or a Doji. Try to catch it before the trend actually reverses.

Pairing Heikin Ashi candles with other indicators

You can combine the Heikin Ashi chart with other tools like moving averages, the Relative Strength Index (RSI), and the Average True Range (ATR) to increase your probability of success.

Moving averages

A moving average is a line on a chart that shows the average price of an asset over a period of time, such as 50 or 100 days. An Exponential Moving Average (EMA) will do the same, but giving more weight to recent prices so it reacts more quickly to recent price changes. If the asset price is currently above the EMA, the trend is likely moving up, and vice versa. You can therefore use these to confirm and ride the trend.

Relative Strength Index (RSI)

The RSI helps you see whether an asset is overbought (over 70) or oversold (under 30). You can use it to confirm whether you’re entering a strong trend or chasing one that’s coming to an end.

Average True Range (ATR)

The ATR is a tool that shows you what the average price swing is. You can use it to find a realistic price for your stop-loss, such as setting it just outside the asset’s usual price swing. This helps you find the right balance between avoiding getting stopped out of a good trade and taking excessive risk.

Common mistakes to avoid

Heikin Ashi charts have their pros and cons, and will be useful, or not, depending on your trading strategy. Every trading tool has a specific purpose, and it doesn’t make sense to use it for something else. You shouldn't use an air fryer to boil pasta, and likewise you shouldn't use Heikin Ashi candles for trading strategies that aren't adapted to it. Below are some of the most common mistakes traders make when trading with Heikin Ashi candles.

  1. Using the chart to scalp
    If you try to use a Heikin Ashi chart to scalp and place quick trades using short periods like the 1-minute chart, the delay will mislead you. By the time a candle confirms a move, the price may already be different. That’s why Heikin Ashi candles work better on longer timeframes like the 4-hour or daily chart, where quick reactions matter less and trend clarity matters more.
  2. Using Heikin Ashi candles to set stop-losses or target levels
    If you set your stop-loss or profit-taking limit based on the highs and lows of a Heikin Ashi candle, you might get stopped out too soon or miss your target completely. That’s why you should always check the actual price levels on a regular candlestick chart before placing orders.
  3. Trading without confirmation
    A Doji or a sudden color change can be tempting, but you should wait for confirmation before jumping in too hastily. Waiting for the next candle or looking for support from another indicator is always a good idea.
  4. Using Heikin Ashi candles to guess turning points
    Heikin Ashi charts aren’t made for catching perfect tops or bottoms. They make it easier to follow trends because they’re great for showing when momentum is strong, but they won’t tell you the exact moment a trend starts or ends.

How to find the Heikin Ashi chart on your platform

  • TradingView: Just change the chart type to “Heikin Ashi.”

  • MetaTrader 5 (MT5): Go to Insert → Indicators → Custom → Heikin Ashi.
    MetaTrader 4 (MT4): This requires a custom indicator you can find for free online.

  • Schwab and Thinkorswim: Change the chart settings.

Share with friends:

Open an FBS account

By registering, you accept FBS Customer Agreement conditions and FBS Privacy Policy and assume all risks inherent with trading operations on the world financial markets.

FBS at social media

iconhover iconiconhover iconiconhover iconiconhover icon

Contact us

iconhover iconiconhover iconiconhover iconiconhover icon
store iconstore icon
Get on the
Google Play
store iconstore icon
Get MT4 on the
App Store
store iconstore icon
Get MT5 on the
App Store

Trading

Company

About FBS

Our social impact

Legal documents

Company news

FC Leicester City

Help Center

Partnership programs

The website is operated by FBS Markets Inc.; Registration No. 000001317; FBS Markets Inc. is registered by the Financial Services Commission under the Securities Industry Act 2021, license number 000102/31. Office Address: The Bentley, #16 Cor A Street & Princess Margaret Drive, Belize City, Belize.

FBS Markets Inc. does not offer financial services to residents of certain jurisdictions, including, but not limited to: the USA, the EU, the UK, Israel, the Islamic Republic of Iran, Myanmar.

Payment transactions are managed by HDC Technologies Ltd.; Registration No. HE 370778; Legal address: Arch. Makariou III & Vyronos, P. Lordos Center, Block B, Office 203, Limassol, Cyprus. Additional address: Office 267, Irene Court, Corner Rigenas and 28th October street, Agia Triada, 3035, Limassol, Cyprus.

Contact number: +357 22 010970; additional number: +501 611 0594.

For cooperation, please contact us via [email protected].

Risk Warning: Before you start trading, you should completely understand the risks involved with the currency market and trading on margin, and you should be aware of your level of experience.

Any copying, reproduction, republication, as well as on the Internet resources of any materials from this website is possible only upon written permission.

The information on this website does not constitute investment advice, a recommendation, or a solicitation to engage in any investment activity.