Sometimes, a futures contract for an asset like oil or gold, costs more, or less, months down the line than it does today. That’s where strange-sounding terms like contango and backwardation come in.
July 04, 2025
Basics
Sometimes, a futures contract for an asset like oil or gold, costs more, or less, months down the line than it does today. That’s where strange-sounding terms like contango and backwardation come in.
Traders and analysts pay close attention to these patterns because contango and backwardation say a lot about what’s happening behind the scenes and can predict the market’s future.
So, what are they? Let’s explore.
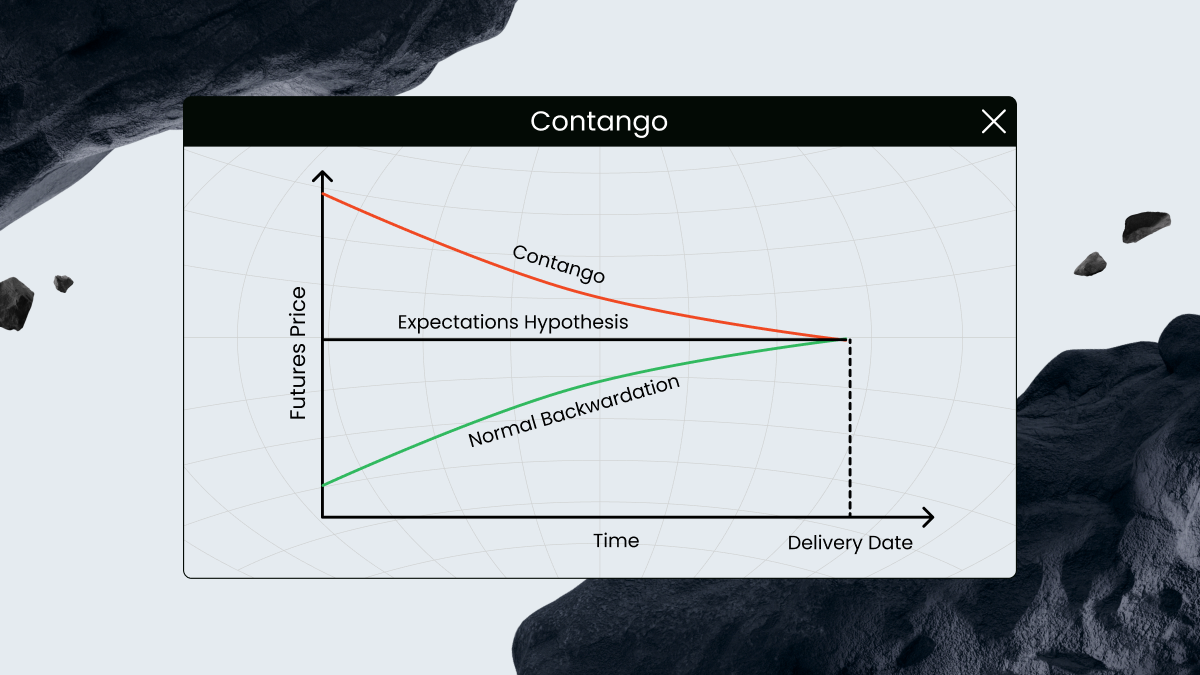
If the price for a future delivery is higher than today’s price, that’s contango. Think of it as the price going uphill.
If it’s the other way around, and the future price is lower than today’s, that’s backwardation. The price of the asset is sliding downhill.
These patterns aren’t just numbers. They tell us what people think will happen with supply and demand or how easy it will be to keep stockpiles around.
In a contango market, traders are paying a premium for future delivery. Why? Mostly because of something called the cost of carry: expenses like storage, insurance, and financing. Let’s say you’re buying barrels of oil to be delivered in six months. If you don’t need them right now, you’ll need to store them somewhere and insure them until then. That costs money, and that cost is factored into the price.
This is common with commodities like oil, natural gas, or metals, especially when supply is abundant and demand is steady.
But here’s the kicker: futures prices are not set in stone. They’re constantly shifting based on how traders view the future spot price. If everyone starts thinking oil will be cheaper in six months, that rising curve might flatten or even flip into backwardation.
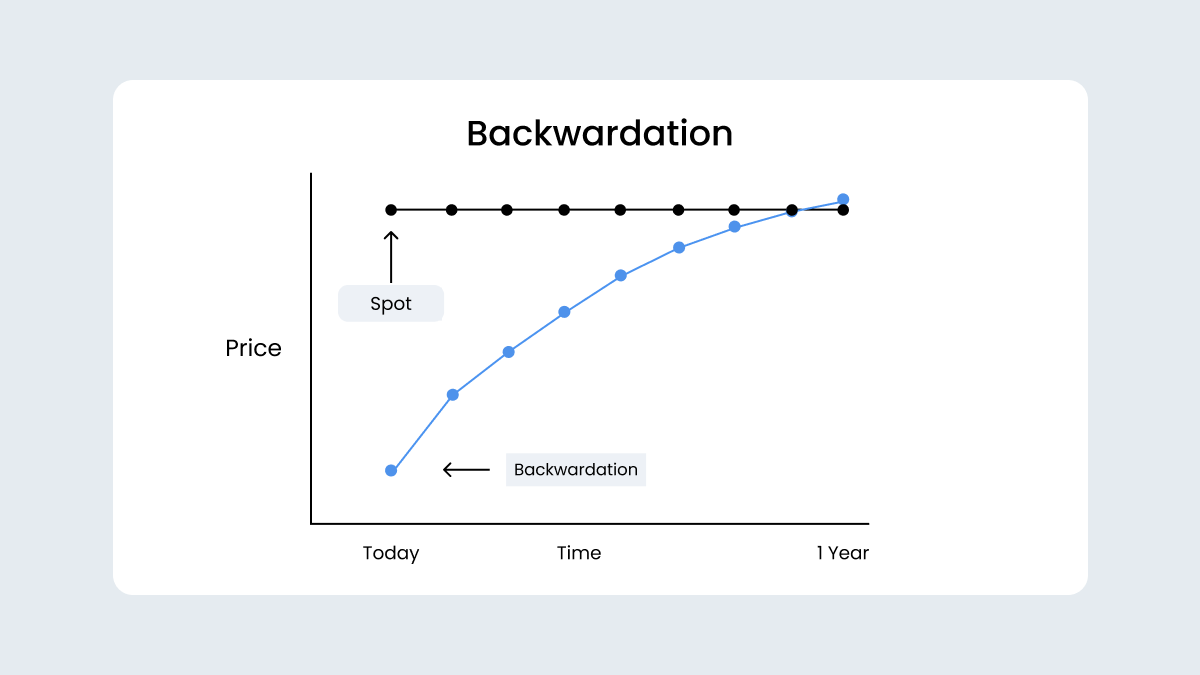
In a backwardation market, the current price is higher than prices for future delivery. This might sound counterintuitive, but it often gives you a signal that supply is tight or demand is too high.
For example, if factories need copper right now to keep production on track, they’ll pay a premium for fast delivery. That urgency drives up the spot price.
Enter the concept of convenience yield: the implicit benefit of holding the actual commodity in your warehouse today, rather than relying on a future delivery. When inventory levels are low, that benefit (or yield) is high. And when stocks are overflowing? The yield drops.
At a basic level, contango suggests that the market expects prices to rise over time. The reasons include inflation, anticipated supply shortages, or rising demand. Backwardation, meanwhile, points to hints at current scarcity or urgency, even if the long-term outlook is more balanced.
That said, the curve is a living thing. It changes with every headline, inventory report, or shift in monetary policy. So while it can’t predict the future with certainty, it does give us a peek into what traders think the future holds.
Let’s break it down:
Contango markets may eat into profits for investors who roll contracts forward, since each new contract is more expensive.
Backwardation, on the other hand, can reward long-term holders as they roll into cheaper contracts that eventually rise toward the spot price.
Traders also pay close attention to convergence. That’s the process where the futures price moves closer to the spot price as the contract approaches expiration. If it didn’t, arbitrageurs would have a field day exploiting price mismatches.
Why should traders care about contango or backwardation?
It gives you a window into how the market is feeling. If prices are climbing over time (contango) or dropping (backwardation), that changes how you trade, hedge, or even whether you stay out. It’s a signal, not just a chart.
Do futures prices stay in contango or backwardation?
The curve moves constantly. One week it’s contango, the next it’s not. Prices shift when the outlook changes: could be a supply hit or new data. The market adjusts, and the curve follows. Simple as that.
What’s the big idea for traders?
If you understand how the futures curve works, you’re not just guessing — you’re reading the market’s mood. The slope of that curve says a lot about supply, demand, and timing. It won’t make you psychic, but it gets you close.
By registering, you accept FBS Customer Agreement conditions and FBS Privacy Policy and assume all risks inherent with trading operations on the world financial markets.