GBP/USD: local "V-Bottom" pattern
Baca artikel di situs FBS
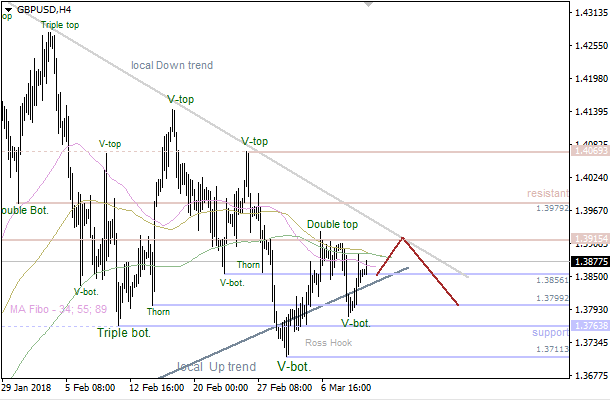
There's a local "V-Bottom" pattern, so the price is testing Moving Averages. The main intraday target is the nearest resistance at 1.3915. If a pullback from this level happens afterwards, bears will probably try to achieve another support at 1.3856 - 1.3799.
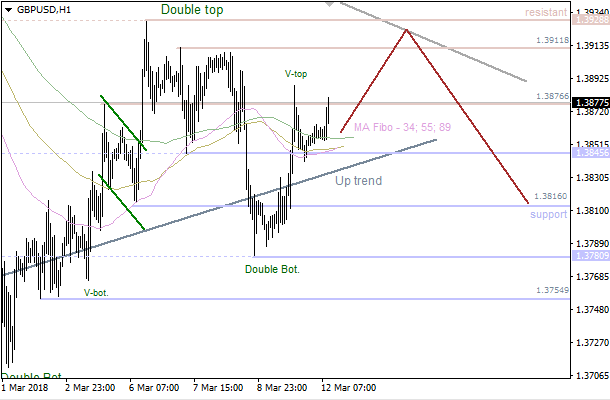
All the Moving Averages have been broken, so the market is likely going to test the next resistance at 1.3918 - 1.3928 in the short term. Meanwhile, if we see a pullback from this area, there'll be a moment for a decline in the direction of the nearest support at 1.3845 - 1.3816.